The portfolio that reads your real data
See every program, backed by the data underneath it. Configurable stage-gates, prioritization, resourcing, and forecasting for the portfolio of projects that produce your products, reading the same structured record as Product Lifecycle and the lab behind it.
The portfolio is only as good as the data underneath It
Most portfolios are run from decks that are stale on arrival. Status gets typed by hand while the experiments, QC results, and formulations behind it keep moving, so a leadership view can look on track even after the lab has already changed.
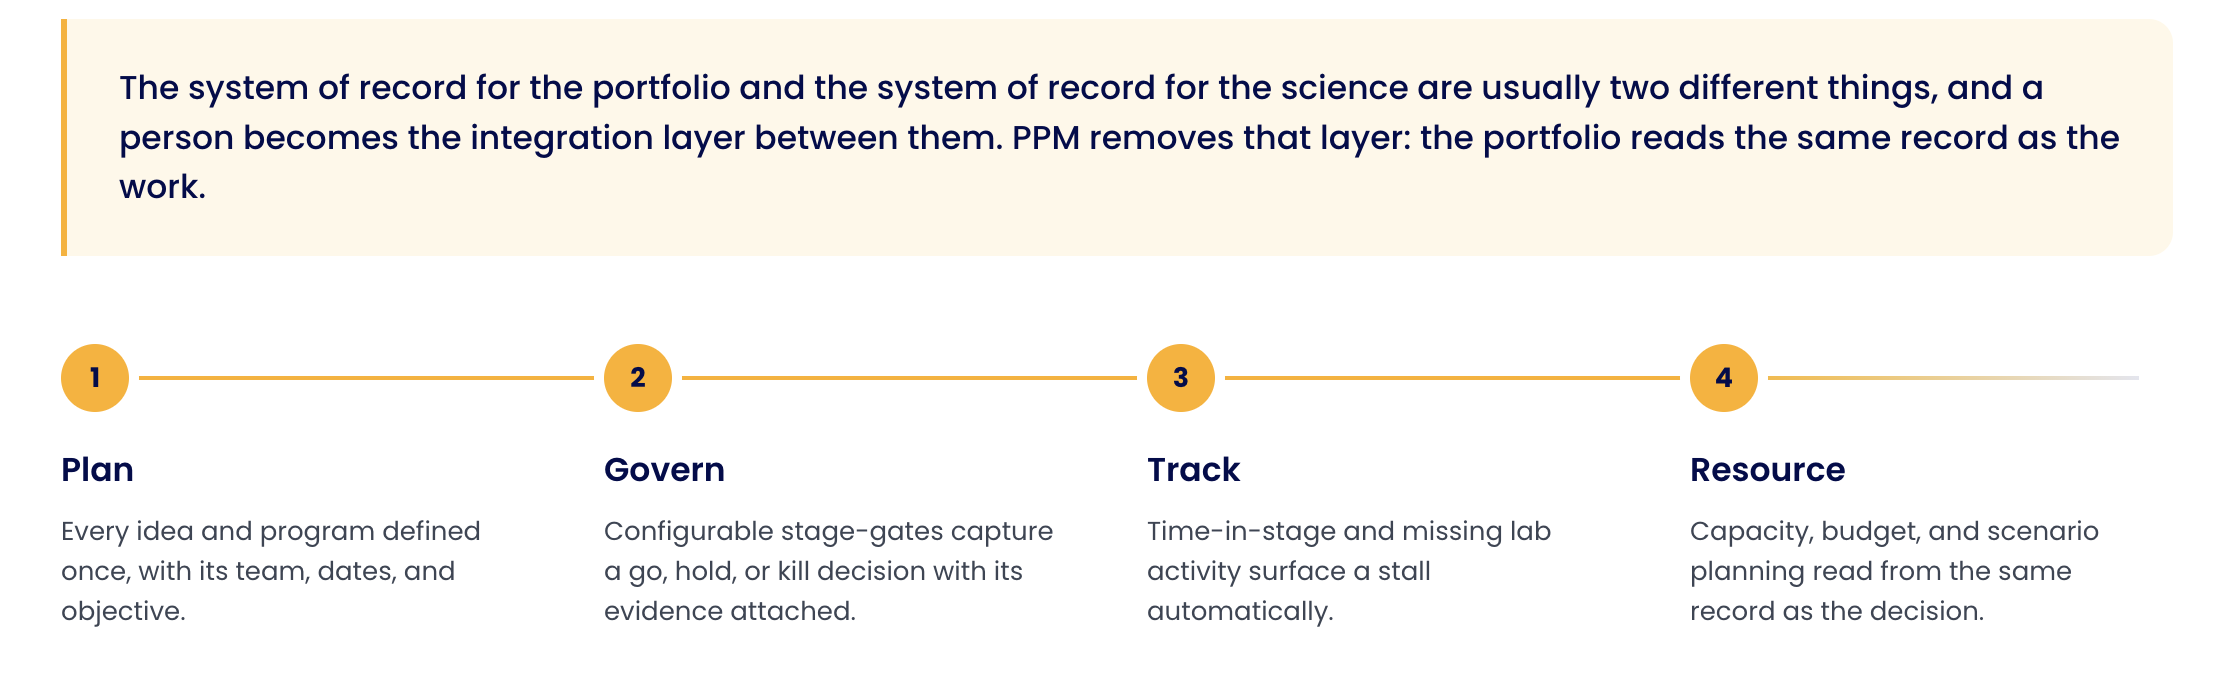
From intake through a gate decision and into resourcing
Every program starts as one record instead of a slide, a spreadsheet, and a status email.
Idea intake at the front: New ideas enter as candidates, get scored, and either become programs or stay visible as things consciously not pursued.
One record per program: Team, dates, objective, innovation type, and stage documentation held on the program itself, not scattered across a tracker, a folder, and a deck.
A live portfolio board: Every program's stage and status visible at a glance, from discovery through launch, so a stalled swap surfaces before the review instead of at it.
Idea intake. Program record. Milestones. Portfolio board
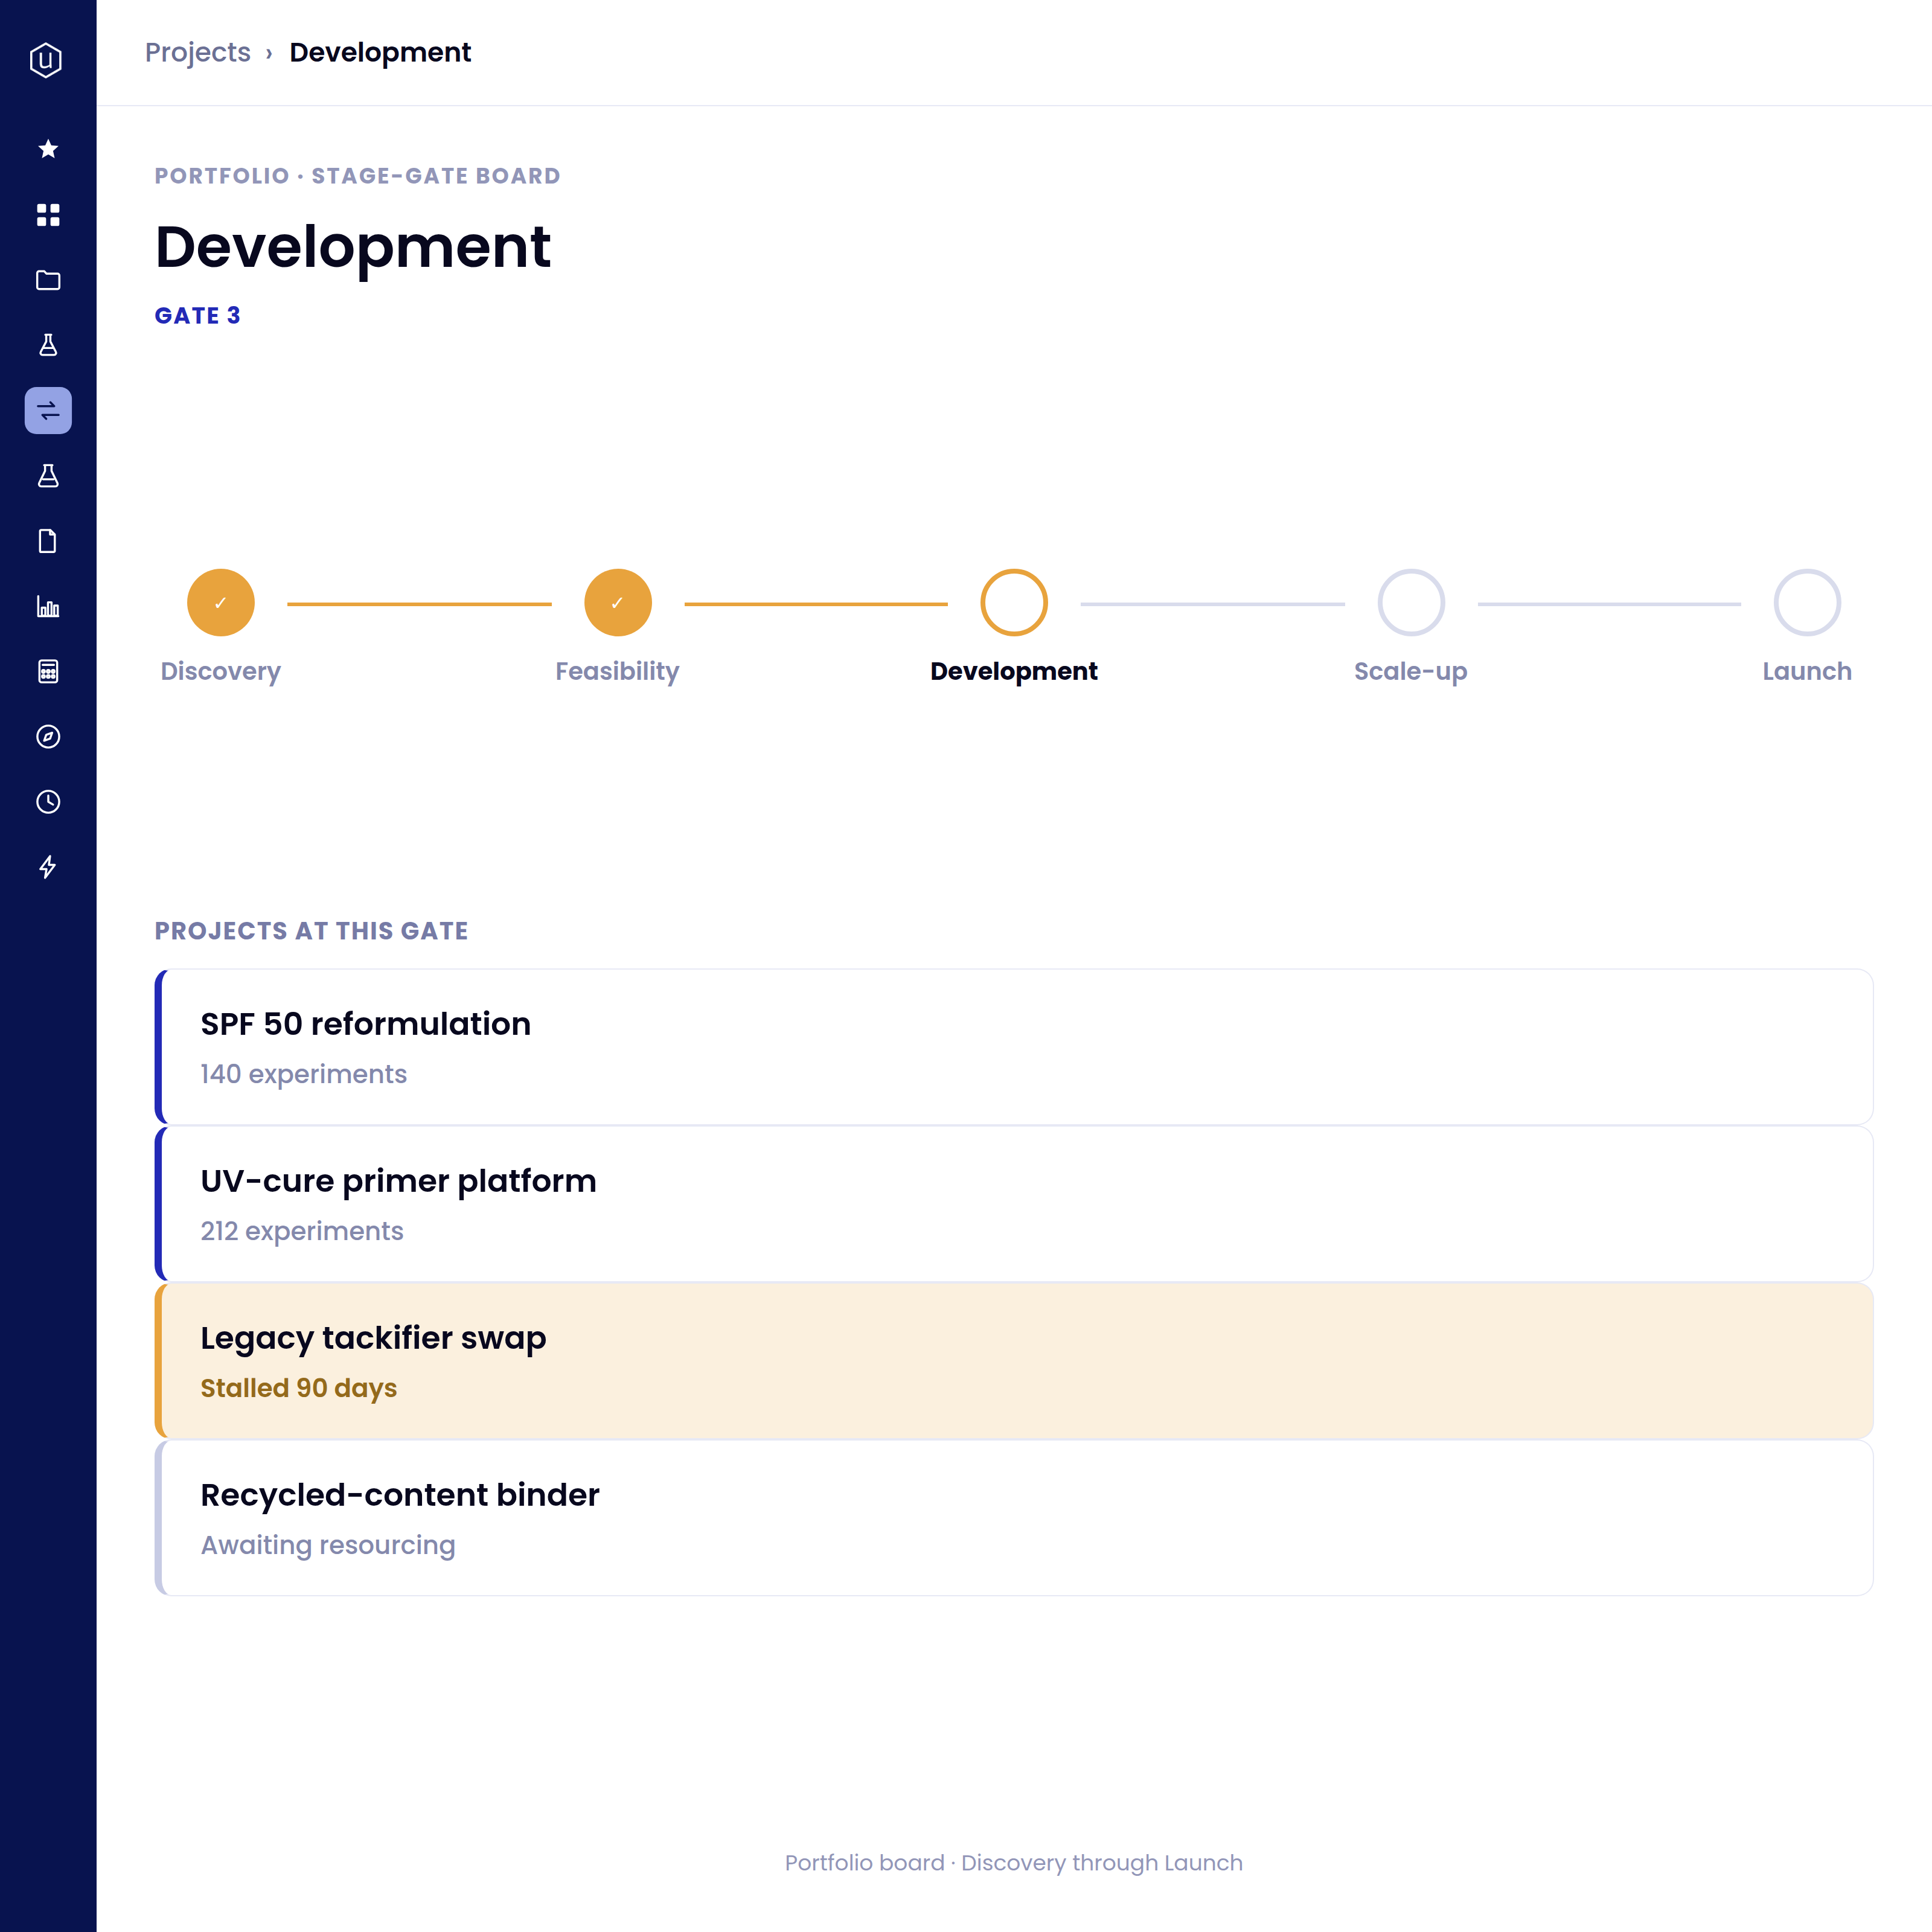
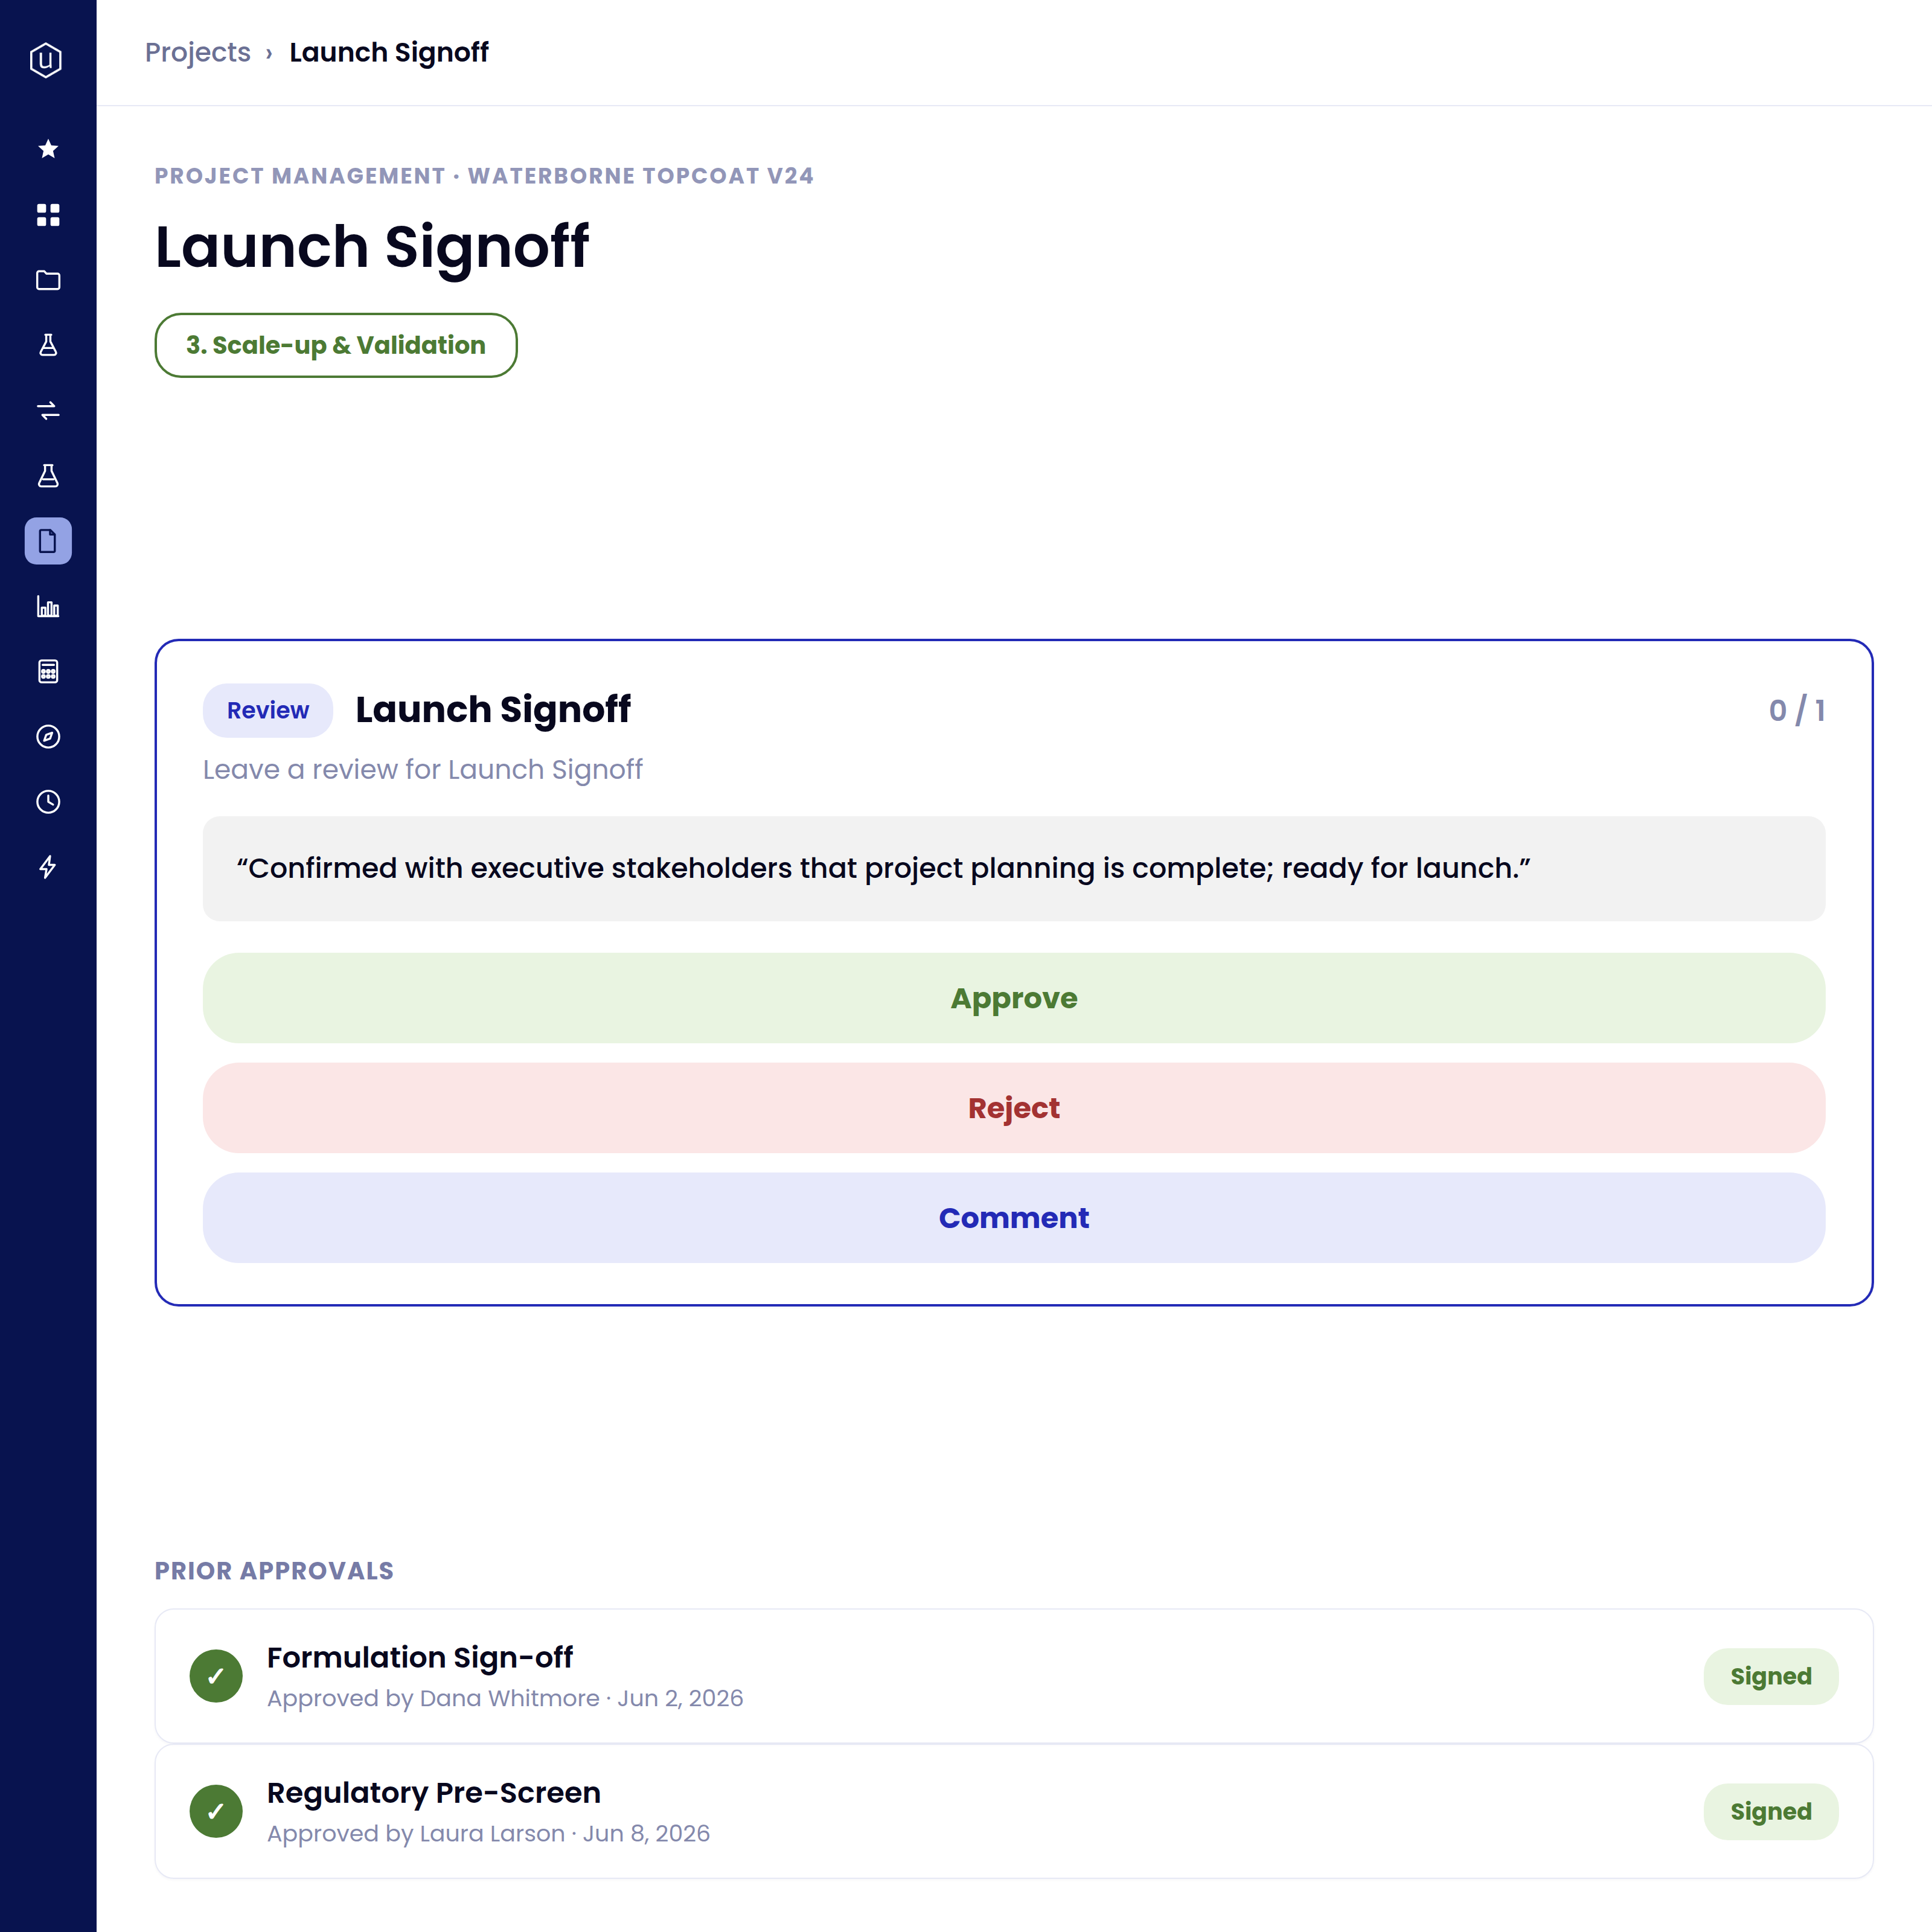
Gates are only useful if the decision is made on evidence, and here the evidence is already attached.
Configurable stage-gates: Initiation and scoping, development and feasibility, scale-up and validation, then launch readiness and handover, configured per business unit rather than fixed platform-wide.
The gate becomes a record, not a ritual: Each gate captures a go, hold, or kill decision with the resourcing call and the supporting lab evidence, reviewed and approved inline.
What the evidence can include: Stability data and QC results against spec, formulation history and the number of iterations, and the open risks behind the decision.
Go / hold / kill. Evidence-backed. Configurable per business unit
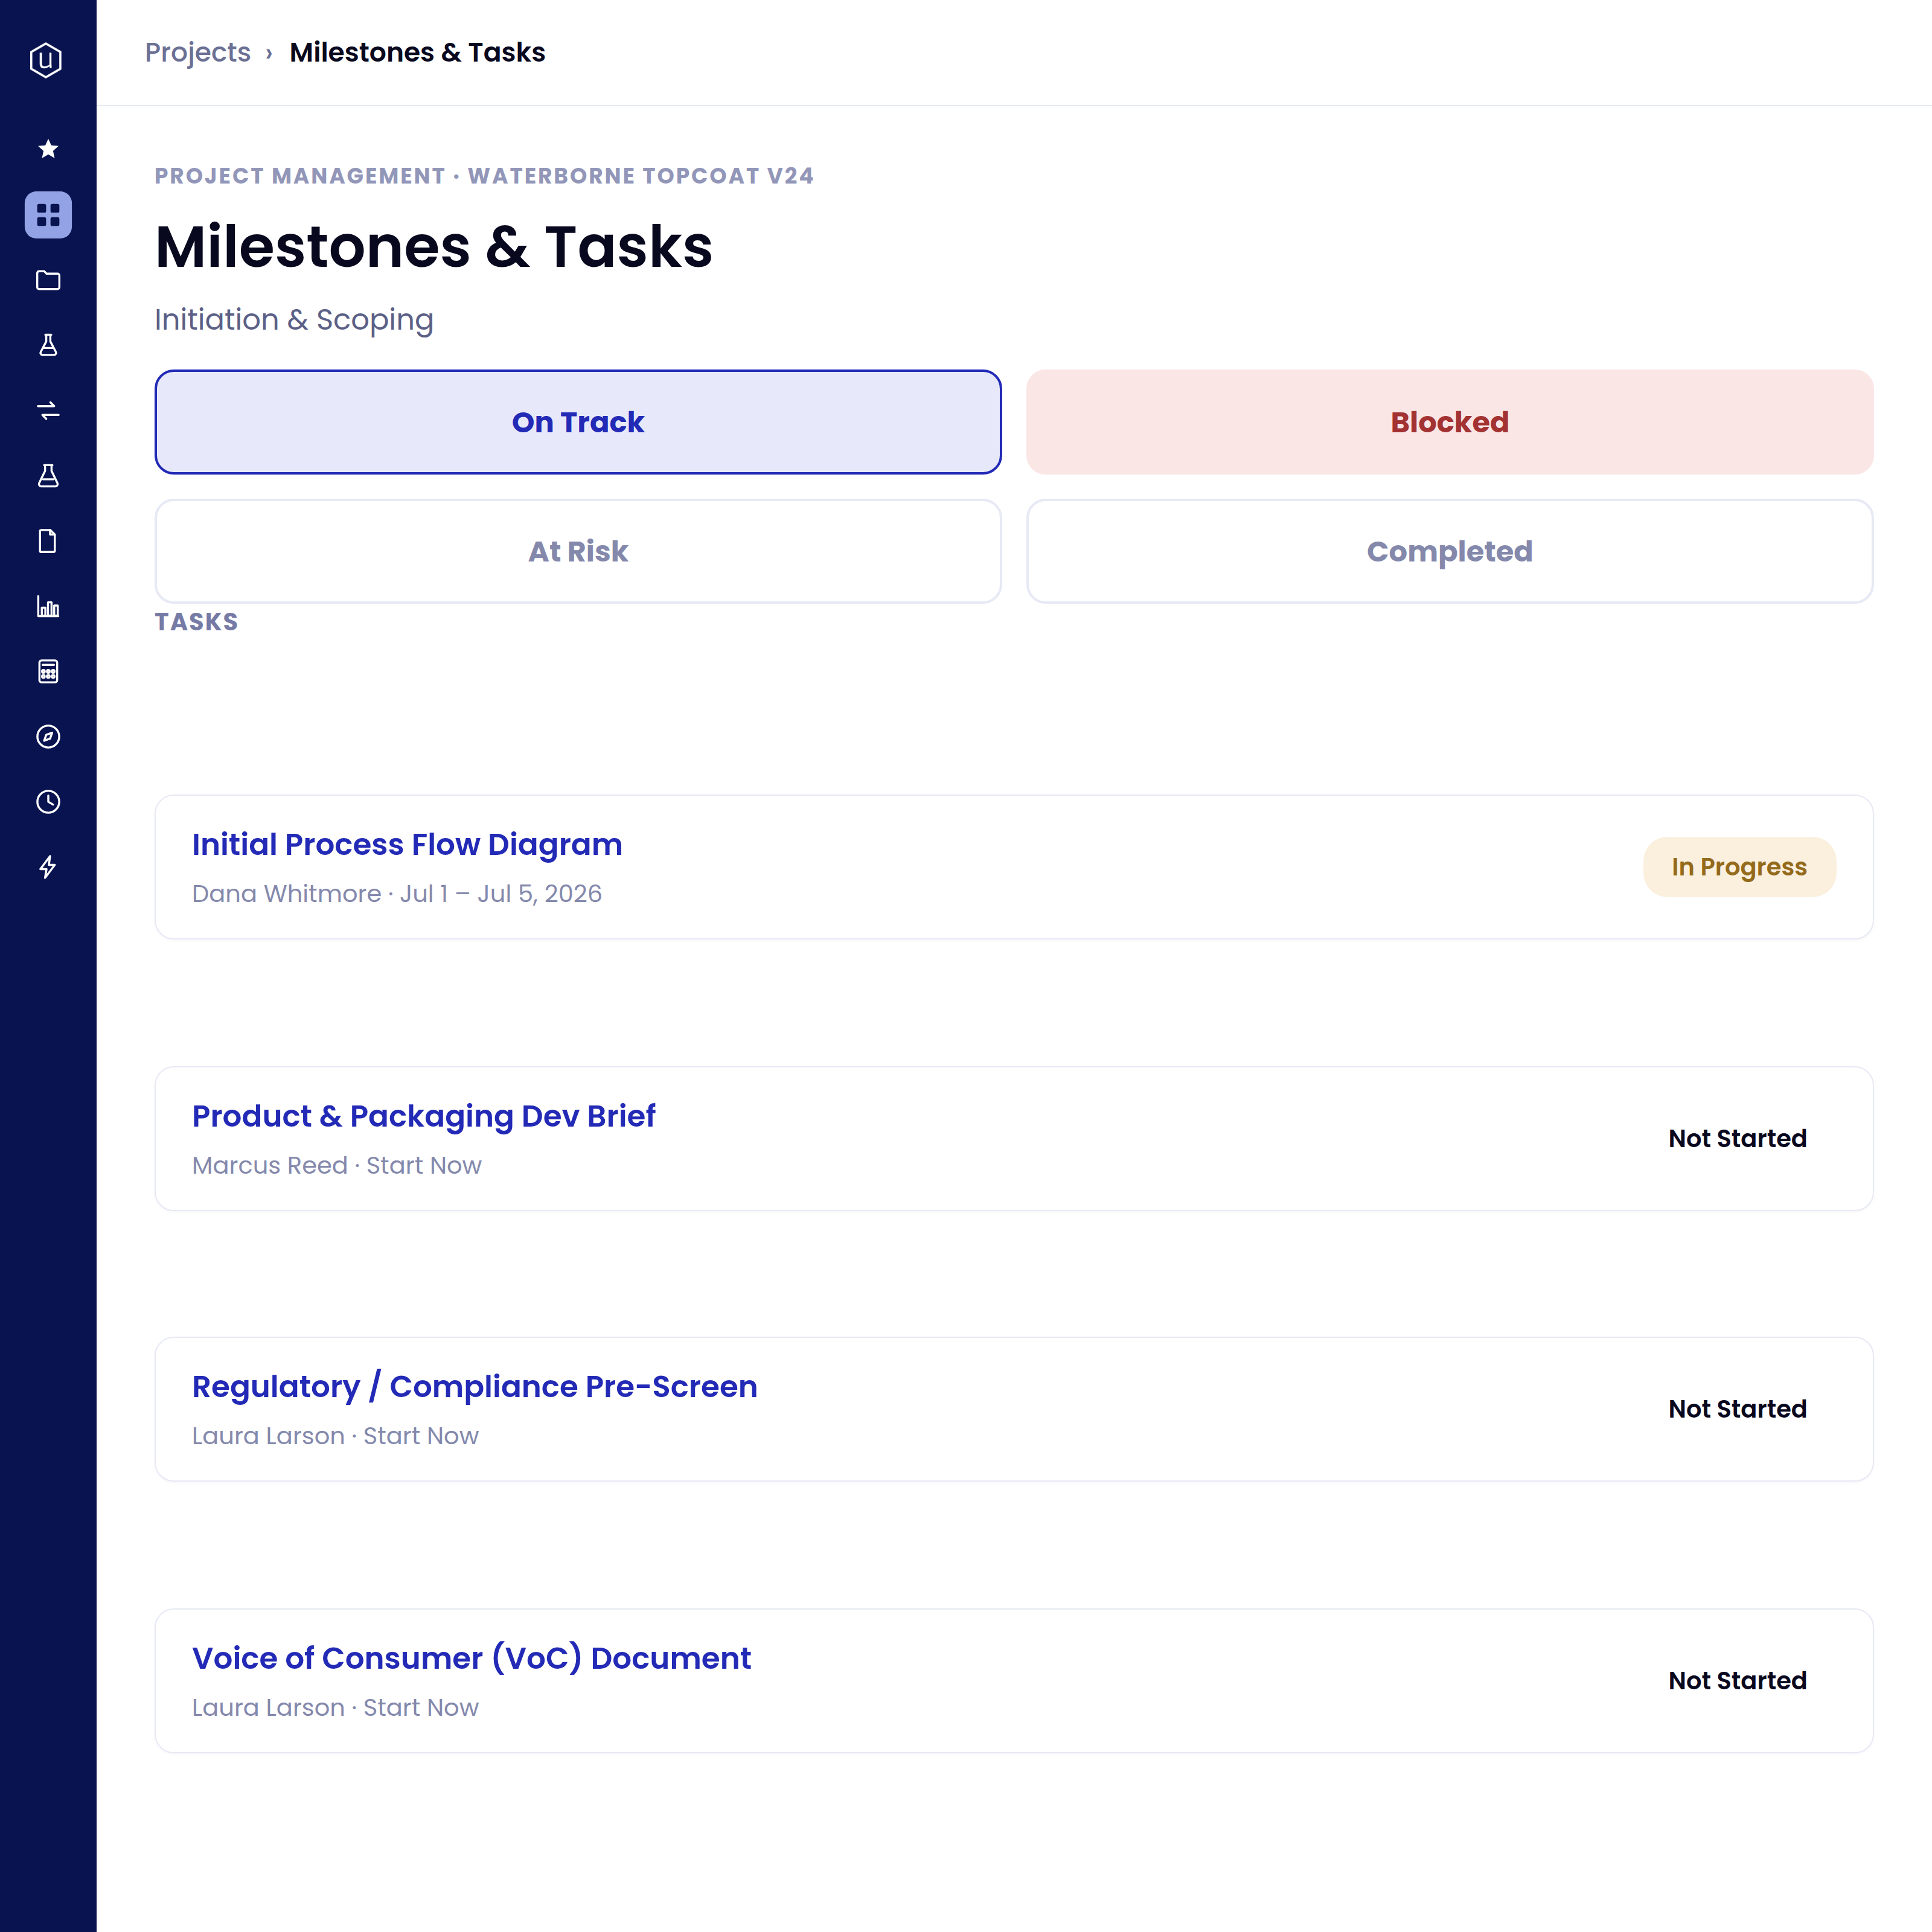
The most expensive program is often the one that stopped moving.
A stall is visible the day it starts: Milestones and tasks track as on track, blocked, at risk, or complete, so a stall surfaces immediately rather than at the next review.
Signals that expose a stall: Time-in-stage that has run past the norm, milestones that came and went unmet, absence of recent experiment or result activity, and patterns across past programs that tend to precede a stall.
Capacity freed, not just flagged: Every person freed from dead work can move to a live program, so rationalizing the portfolio becomes continuous instead of a once-a-quarter event.
On track / blocked / at risk. Time-in-stage. Pattern detection
A portfolio decision that ignores capacity is a wish, not a plan.
Capacity by person, role, and lab: Plan across teams and sites, so the same specialists are not committed to five programs in the same quarter.
The money view: Budget versus actual and cost roll-ups across programs, plus a portfolio-level view of where money and effort are going and what the pipeline is worth.
Scenario planning on real data: What-if planning when a program is delayed or accelerated, reasoning over connected historical data rather than a spreadsheet of assumptions.
Capacity by person / role / lab. Dependencies. Budget vs. actual. Scenario planning

See Project Portfolio Management in action
A standalone walkthrough of planning, governance, stall detection, and resourcing, on a live portfolio rather than a slide.
Where PPM shows up
The idea enters as a candidate, gets scored, and either becomes a program or stays visible as something consciously not pursued, rather than living in an inbox.
The evidence behind the decision, stability data, QC results, formulation history, is already attached to the program, not assembled the night before.
Time-in-stage and missed milestones surface the stall the day it starts, not at the next review.
Capacity by person, role, and lab is visible before the commitment is made, not discovered after both programs are already behind.
Every program is ranked by value, risk, and strategic fit at once, so the ones that should be cut surface, rather than continuing quietly.
The portfolio view reads the same record as the lab, so it's current when it's presented, not stale by the time the deck goes out.
.png)
Manage the portfolio on the same data that runs the lab.
When every project is linked to its experiments, quality, and production, the portfolio view is always current and every gate decision stands on evidence. Structure first, AI second.
FAQs
They manage different objects. Product Lifecycle manages the product: its record, its bill of materials, its versions, from development through commercialization. Project Portfolio Management manages the programs that create products, including gates, prioritization, resourcing, and forecasting. Buyers usually evaluate them against different vendors, which is why Uncountable keeps them as peer products.
AnswIt can flag time-in-stage beyond the norm, missed milestones, and the absence of recent experiment or result activity, so a stall surfaces the day it starts rather than at the next review.er
AnswConfigurable stage-gates with go, hold, or kill decisions and supporting data attached, prioritization scoring by value, risk, and strategic fit, resource and capacity planning by person, role, and lab, portfolio dashboards, revenue forecasting, and idea intake with milestones and dependencies. A Gantt view attaches to each program and maps deliverables to a timeline.
No. PPM governs the portfolio on the same data model as the lab and the product record, which is the connection a general-purpose planning tool does not have. Teams commonly run both, with Uncountable governing the programs and the evidence behind each gate, and the enterprise tool holding the wider corporate portfolio.