A data historian that ties every reading to its batch
When a batch fails QC, Uncountable Data Historian shows your quality team what the equipment did during every step, bound to the batch, its formulation and its results. Keep your plant historian. We add the batch context it lacks.
Deployed by 175+ enterprise product development teams







Deployed by Enterprise R&D and Innovation Teams



Process data,
with its batch attached.
Uncountable Data Historian stores time-series tags from your equipment and binds them to the experiments, steps and results they belong to. Five parts do the work.
Tags
Bindings
Experiment Trace
Points
Run rules
A failed batch rarely explains itself
The formulation was right and the raw material lot passed, yet the viscosity came back out of spec. The answer is usually in what the equipment did during the run. That data sits in a control system, a plant historian or a CSV export that knows the tag but not the batch, so teams match timestamps by hand or repeat the run instead of explaining it.
One record.
Process and results, together.
When tag data is bound to the batch it measured, a scientist sees the conditions of each run next to its formulation and results, with no second system to cross-check.
The old way
The Uncountable way
How teams use Uncountable Data Historian
When a result surprises you, start from the batch and work back to the conditions it ran under.
Find the step it went wrong in
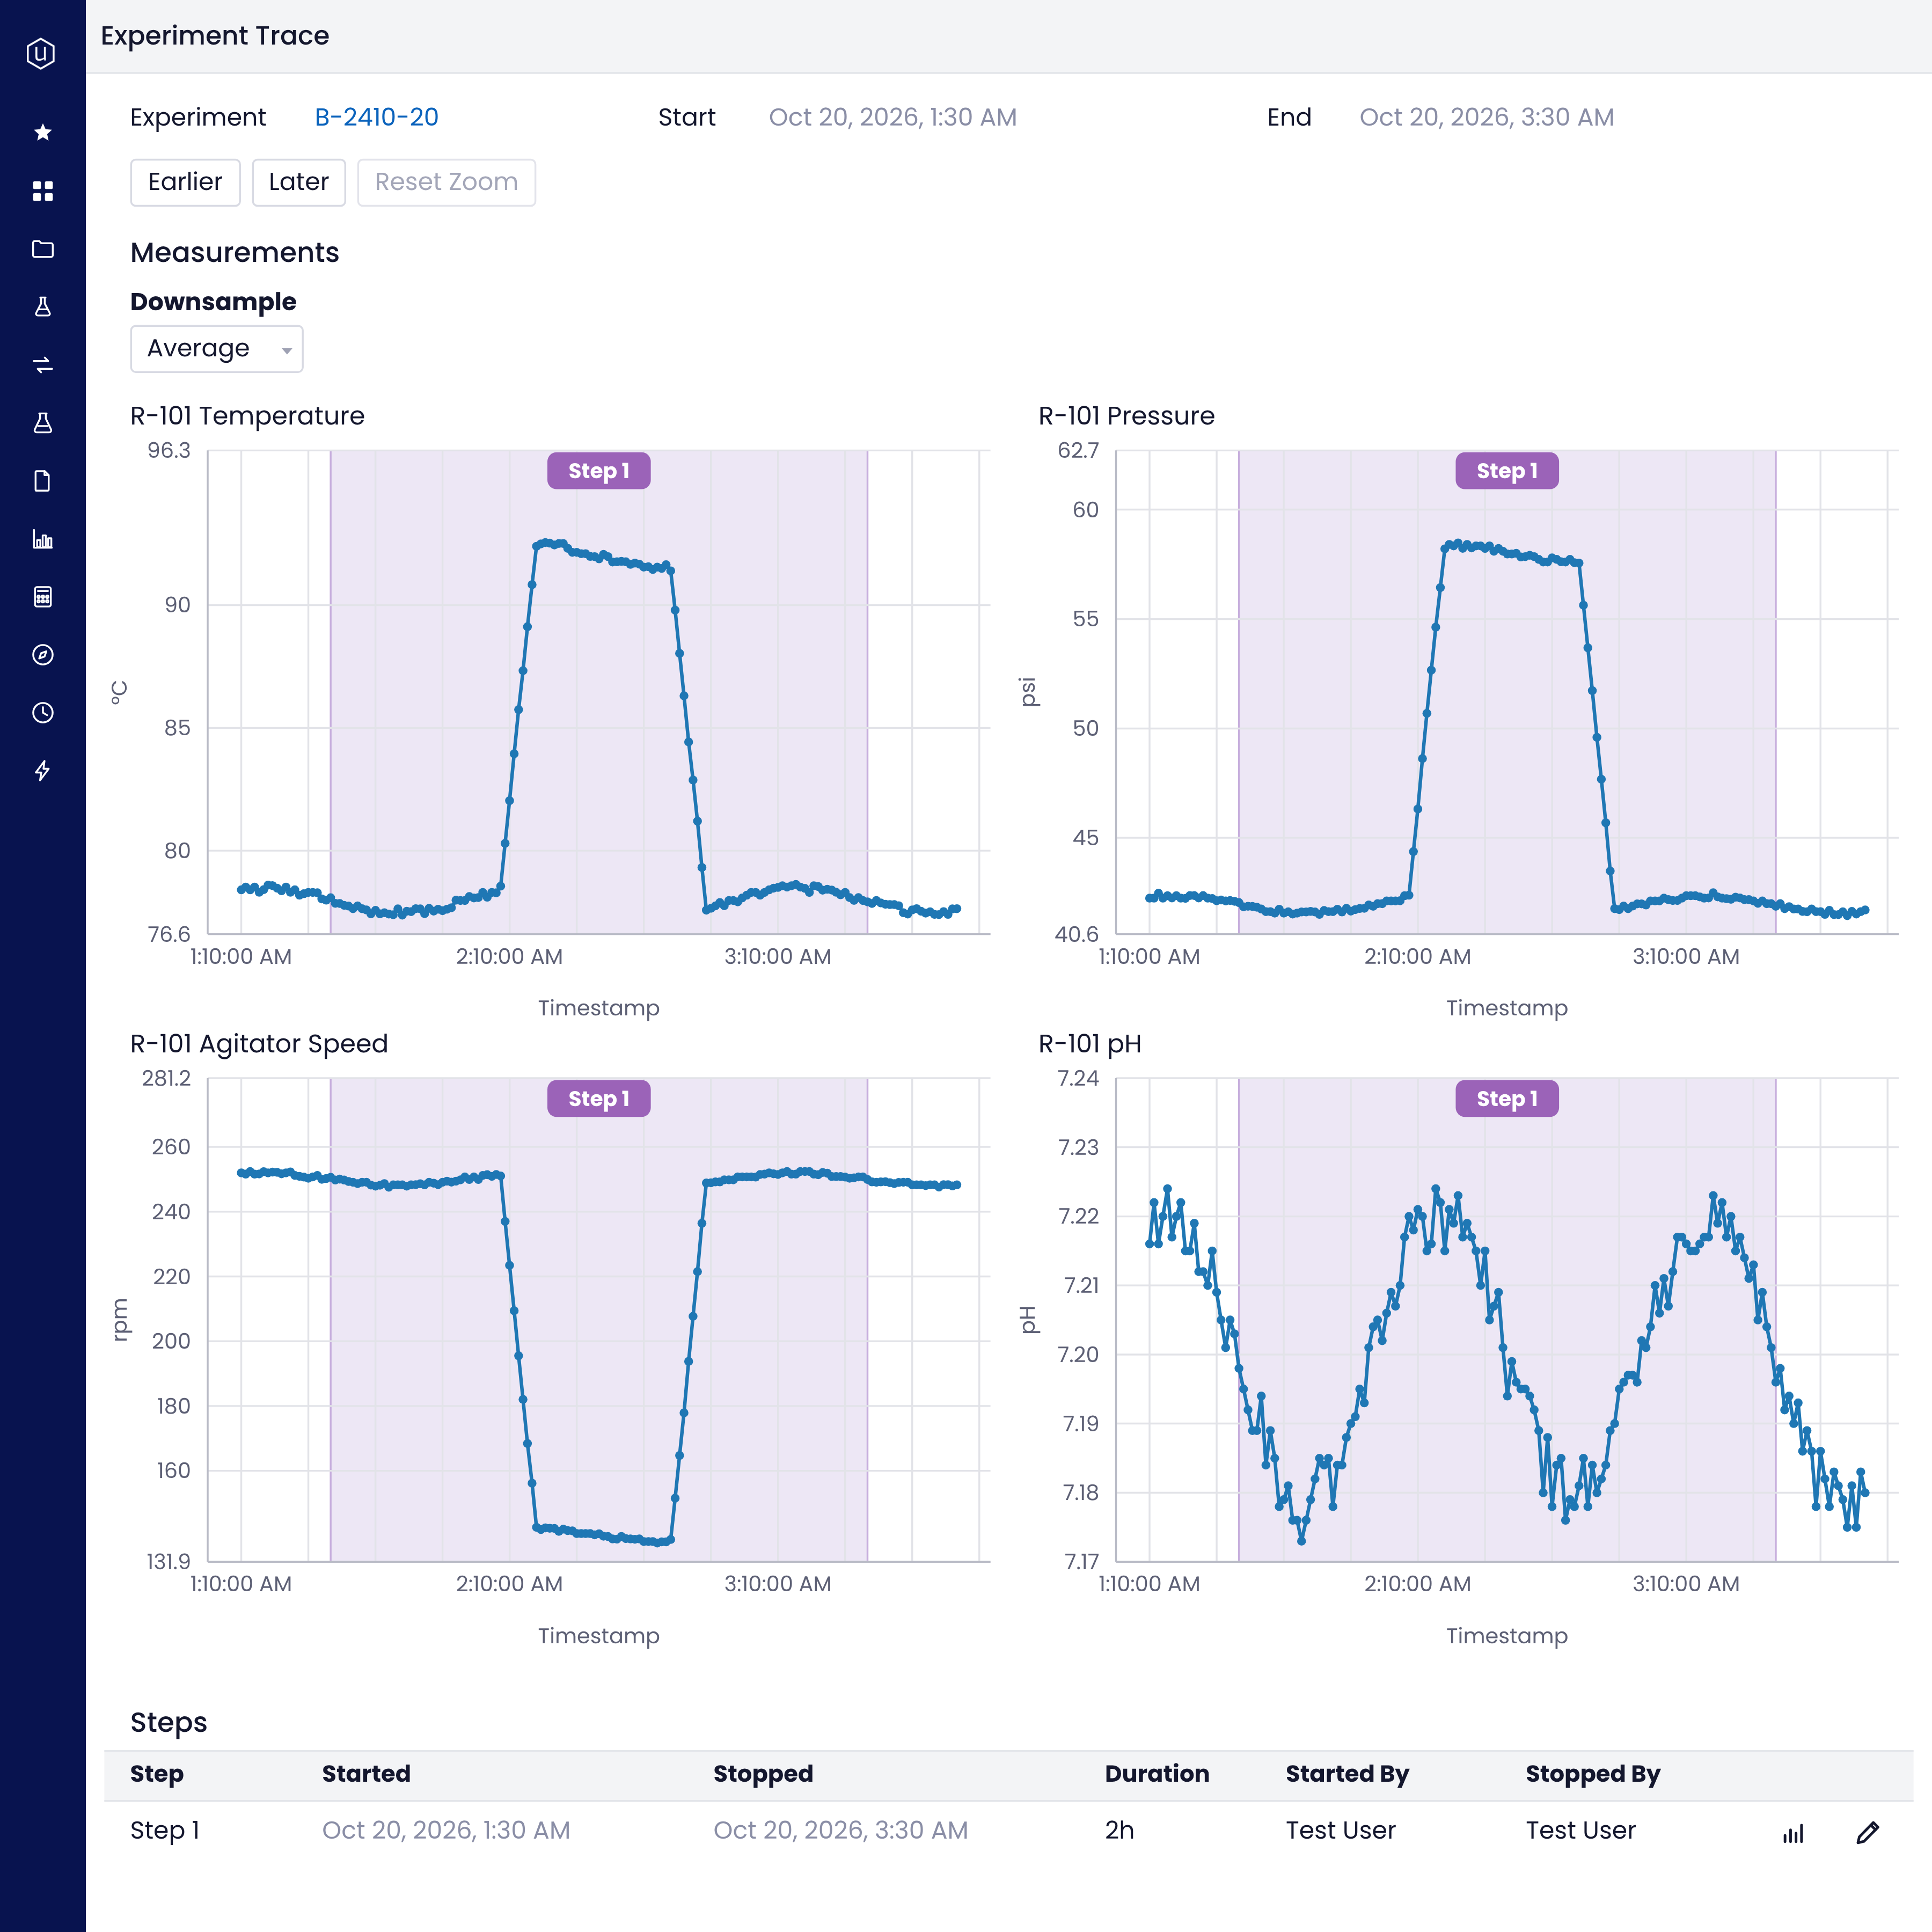
Experiment Trace draws each workflow step over the tag data for that batch, so an excursion during the reaction hold is visible at a glance.
Line up every tag at the moment of failure
Set a reference time on Points and every tag on that equipment lines up over the same window, with zoom and downsampling.
Correct a late step
If a step was logged late, edit its start and stop times on the trace and the step window updates.
So after a failed batch, the conversation starts at the step where it went wrong.
Four steps take a reactor from untracked to traced, batch by batch:
1. Choose the tags
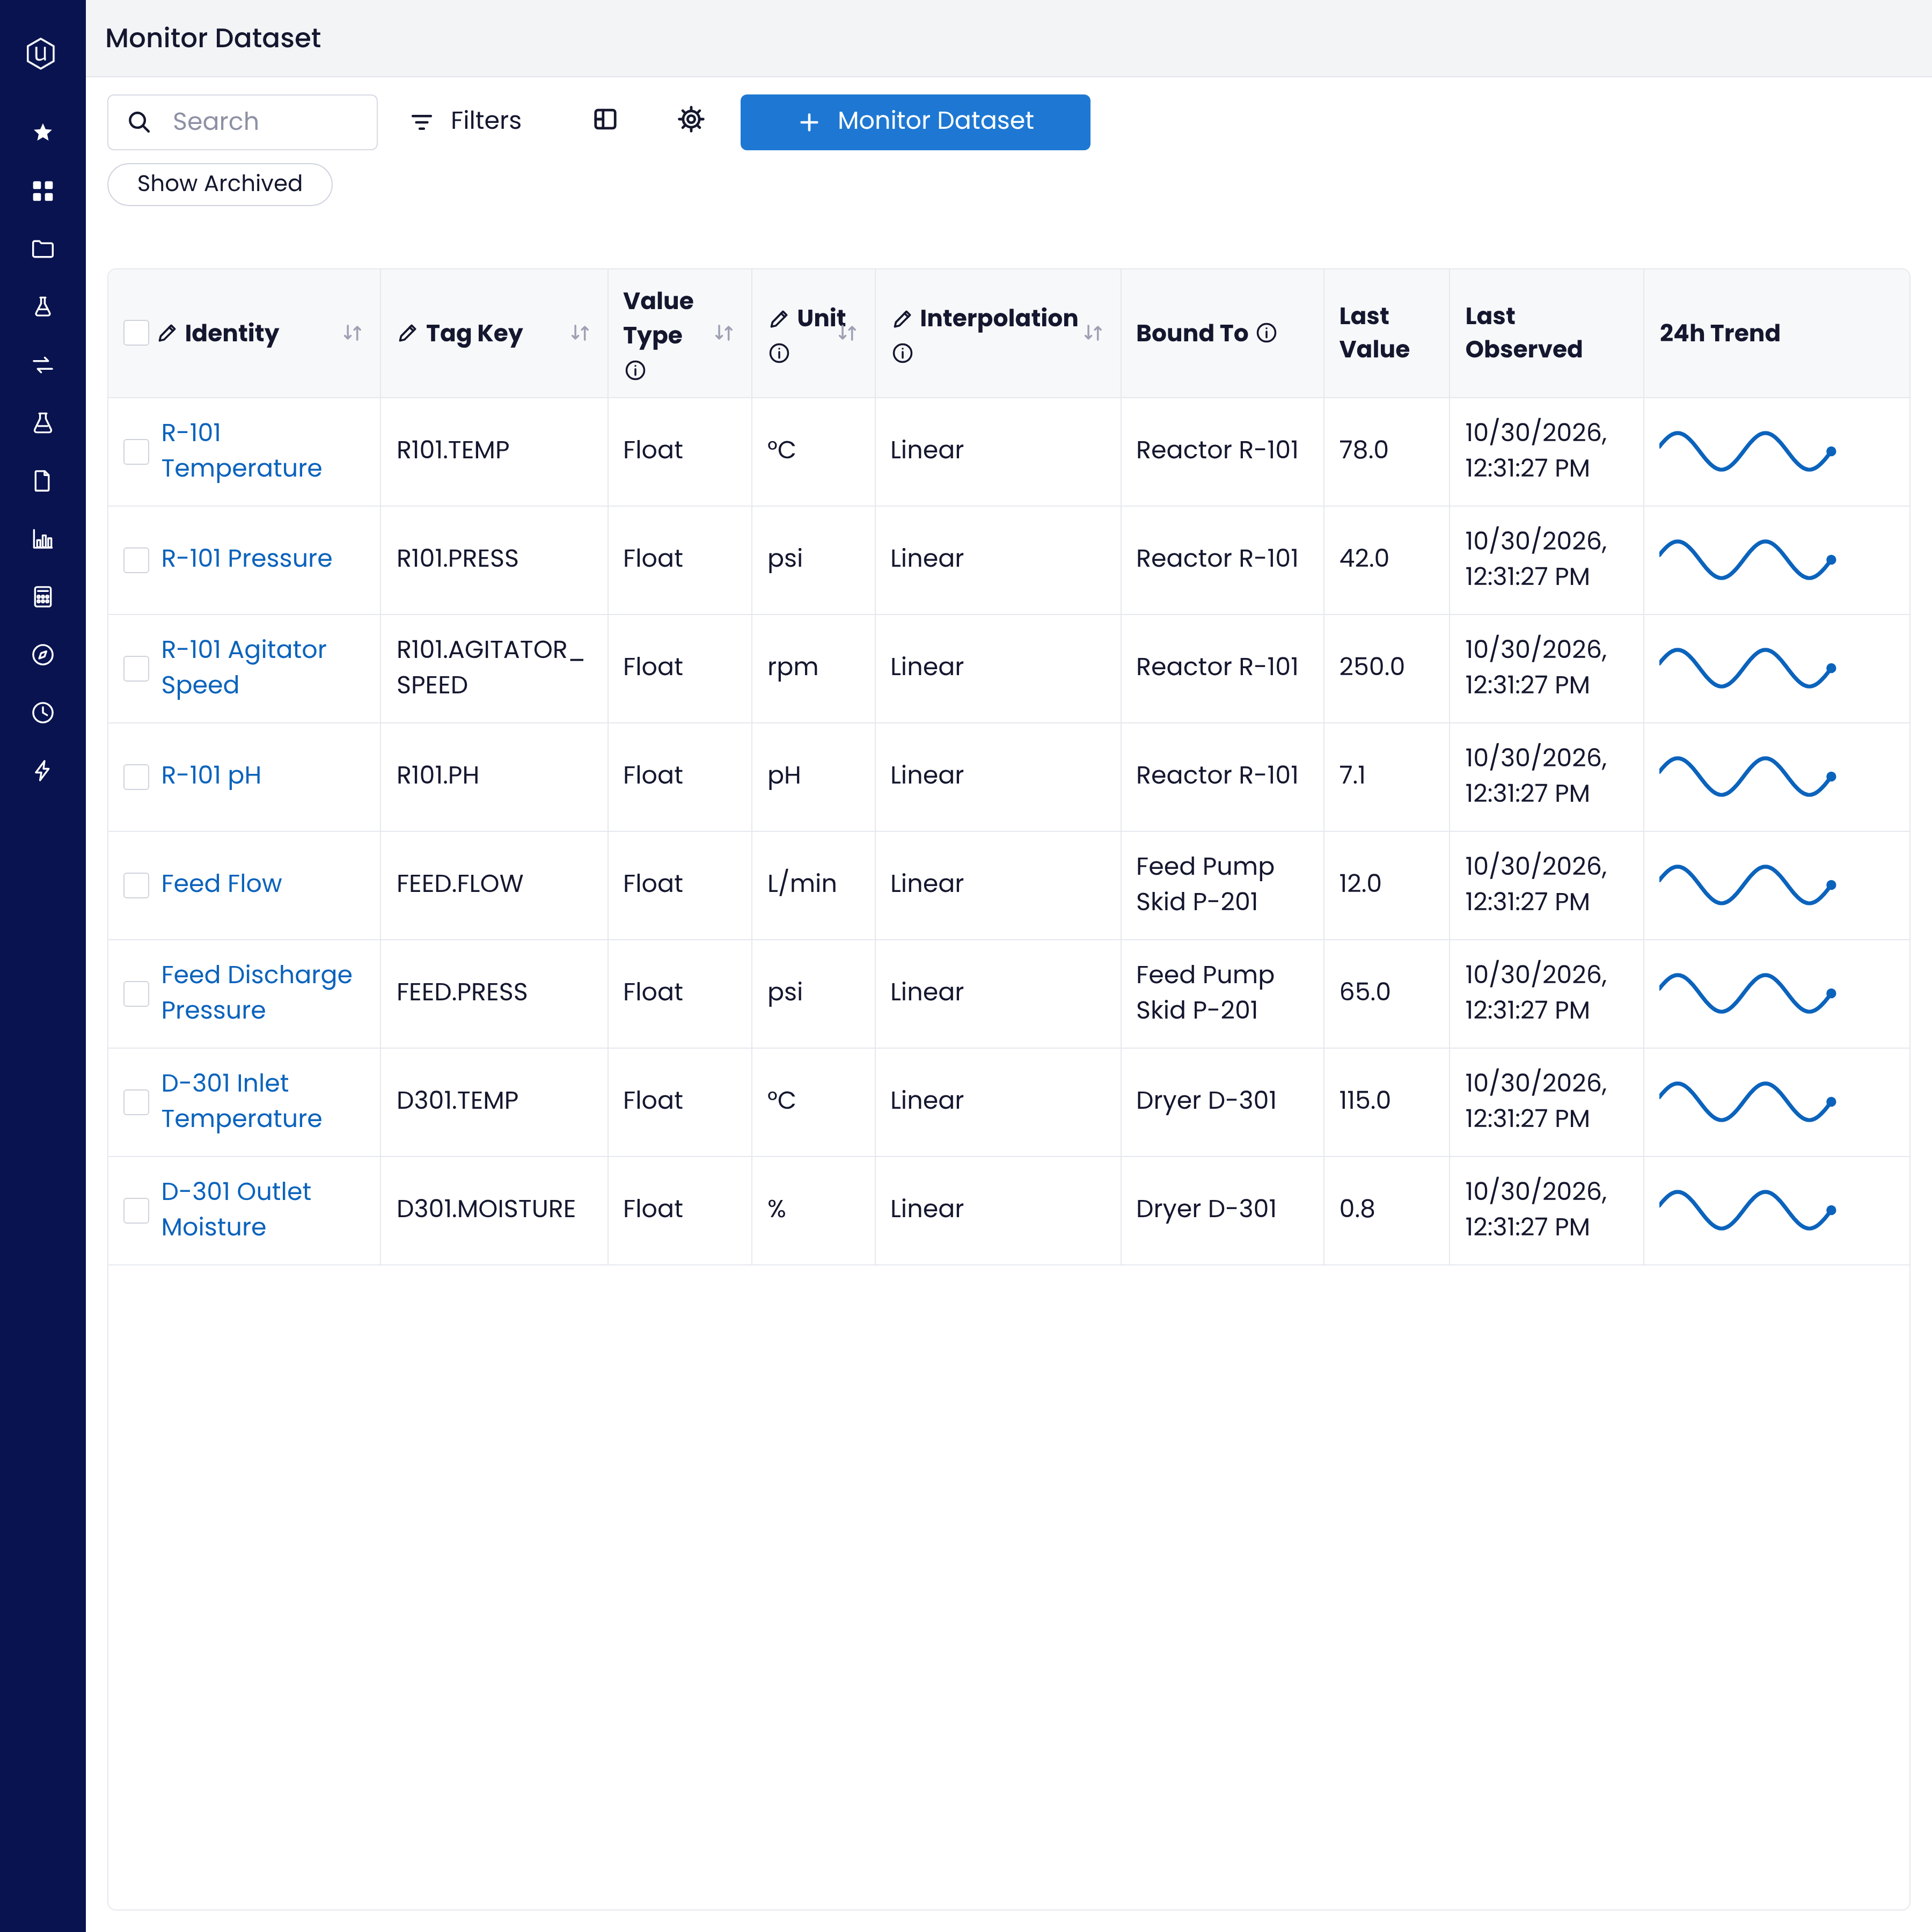
Pick the equipment and signals that most often explain a result, such as reactor temperature, pressure and agitator speed.
2. Send the data
Keep your plant historian. Our team has built integrations from established plant historians, industrial connectivity servers and cloud time-series databases, and sets up yours to send tag data into Uncountable in batches or as a continuous stream.
3. Bind the tags
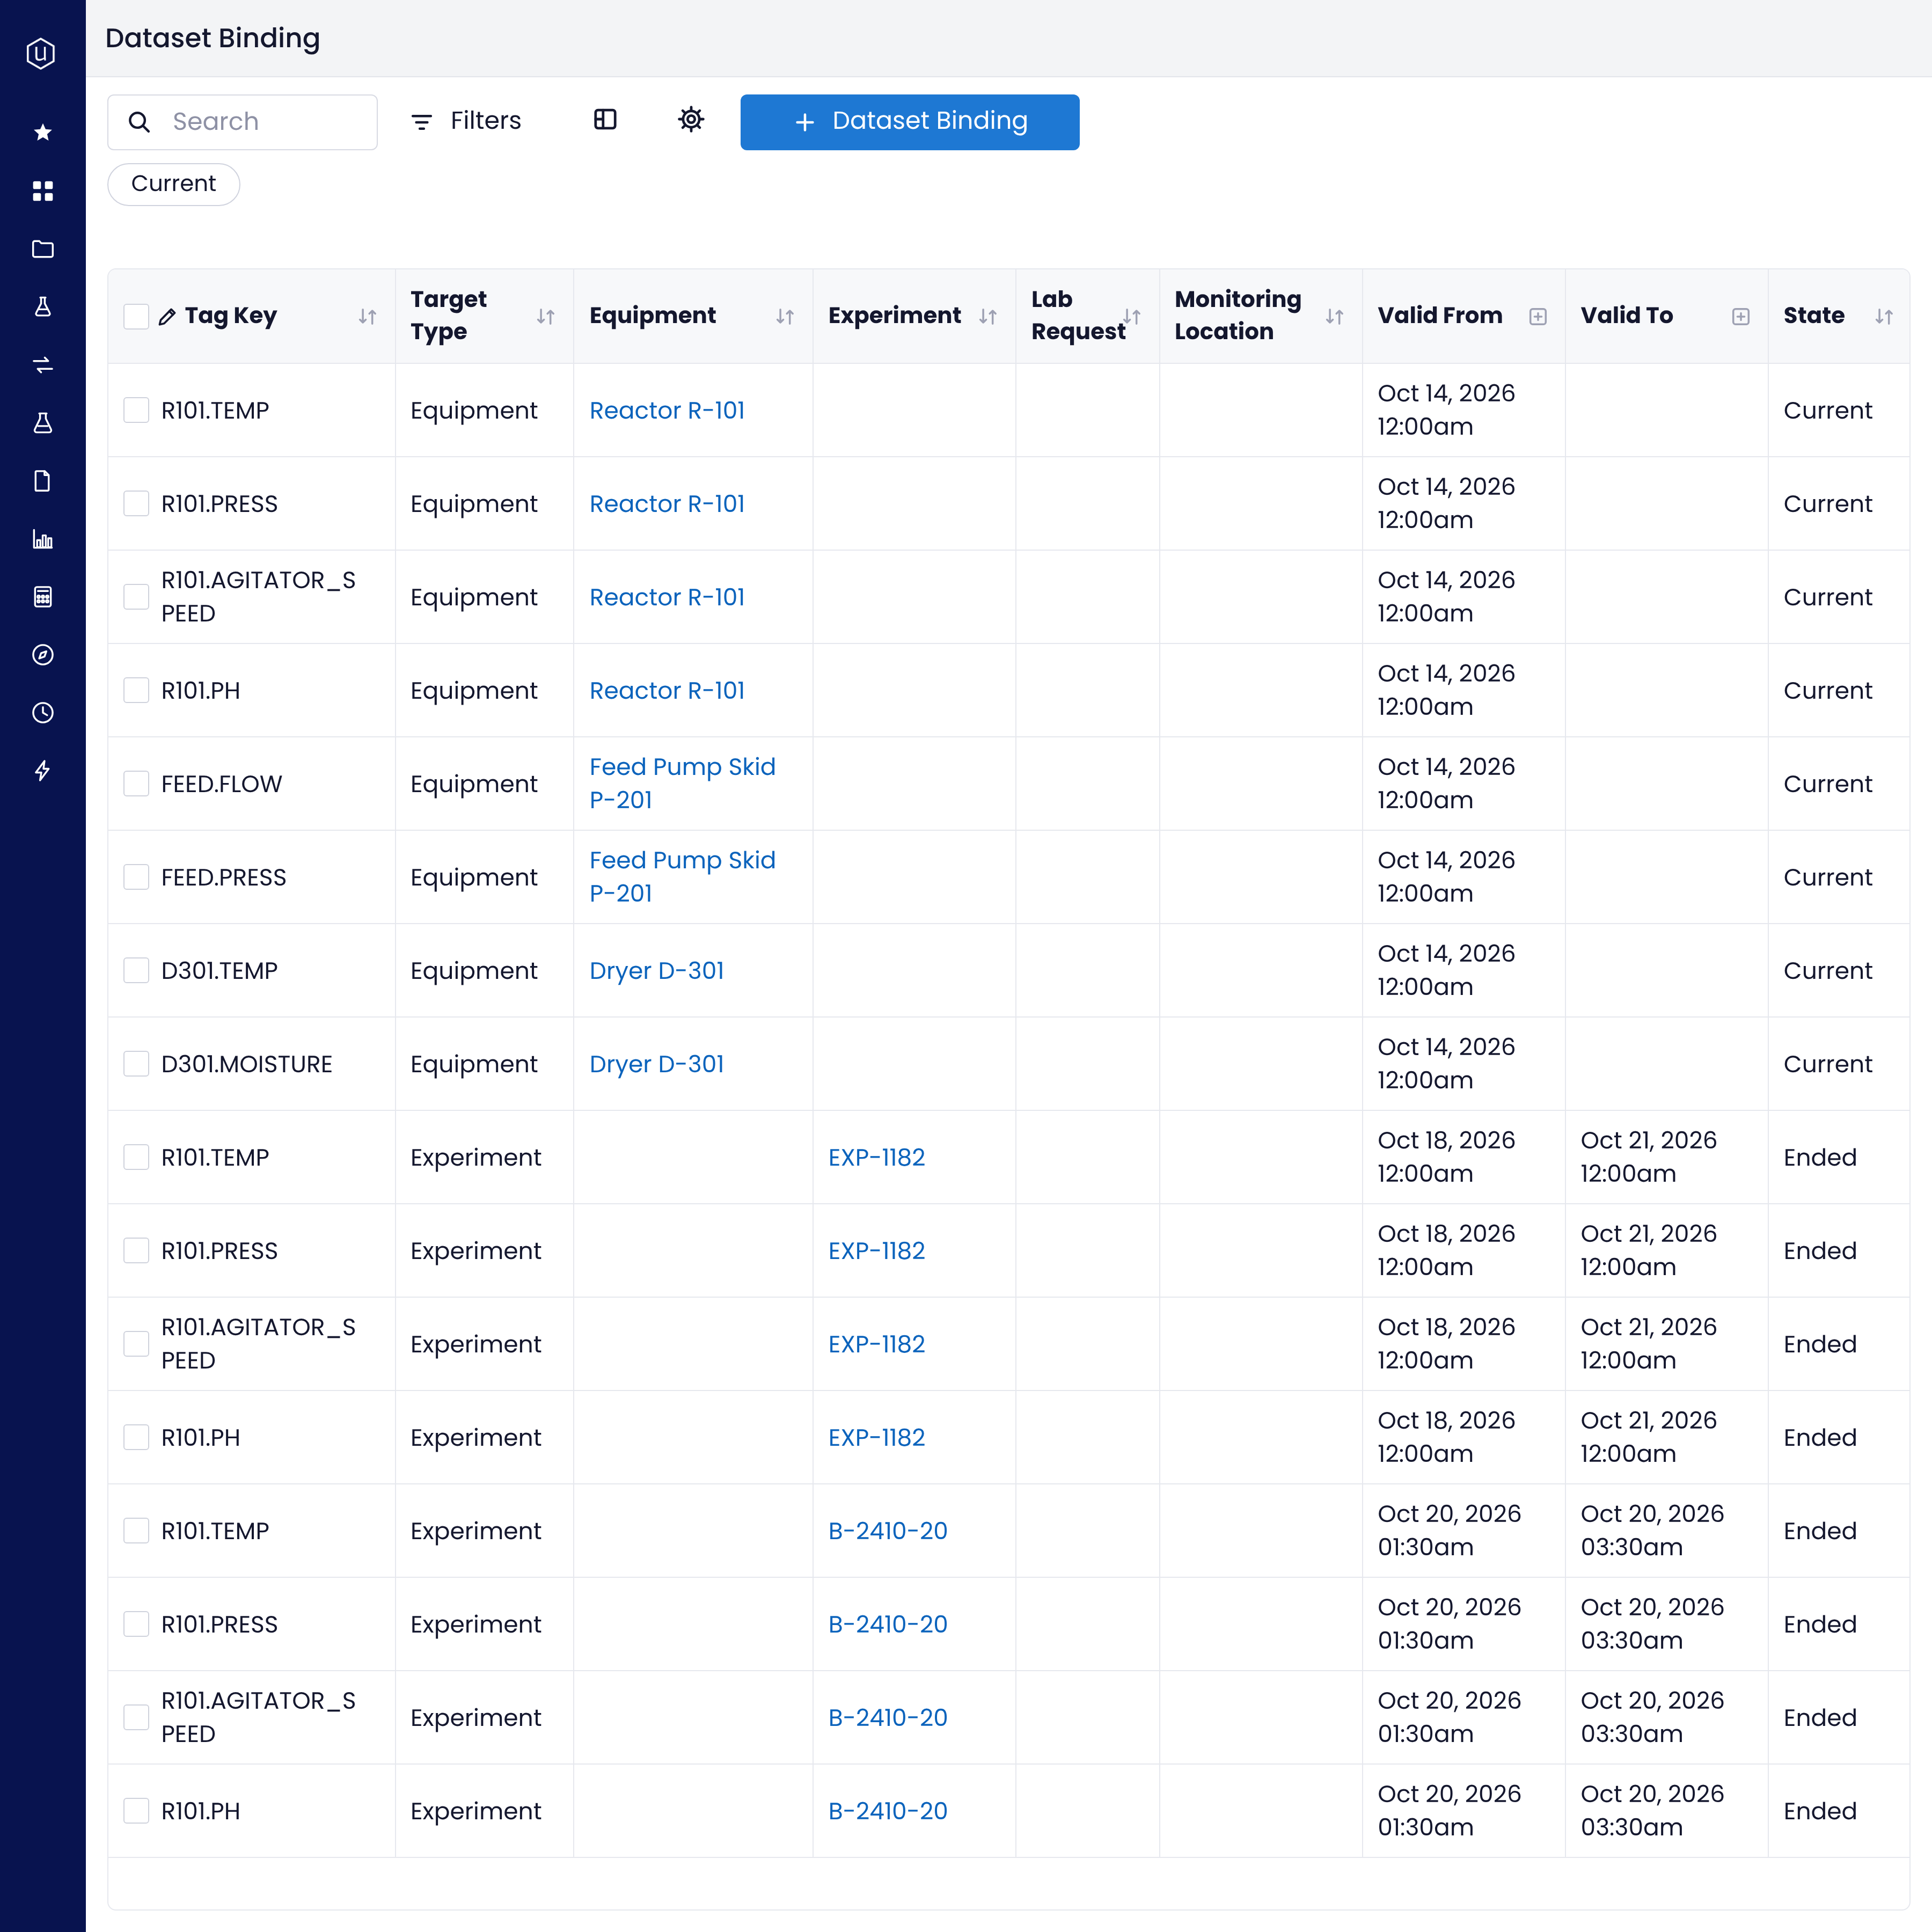
Bind tags to their equipment, then to the experiments that run on it, for the window each batch ran.
4. Trace every batch
Stamp each step in batch execution and the trace shows the tag data across every step of the run.
Every batch that runs on bound equipment arrives with its process history already attached.
For teams already on Uncountable, the historian joins the batch data you capture today:
Experiments and batches
Tag data bound to the batch record it measured.
Workflow steps
Start and stop times, and who ran each step, drawn over the tag data.
Formulations and process parameters
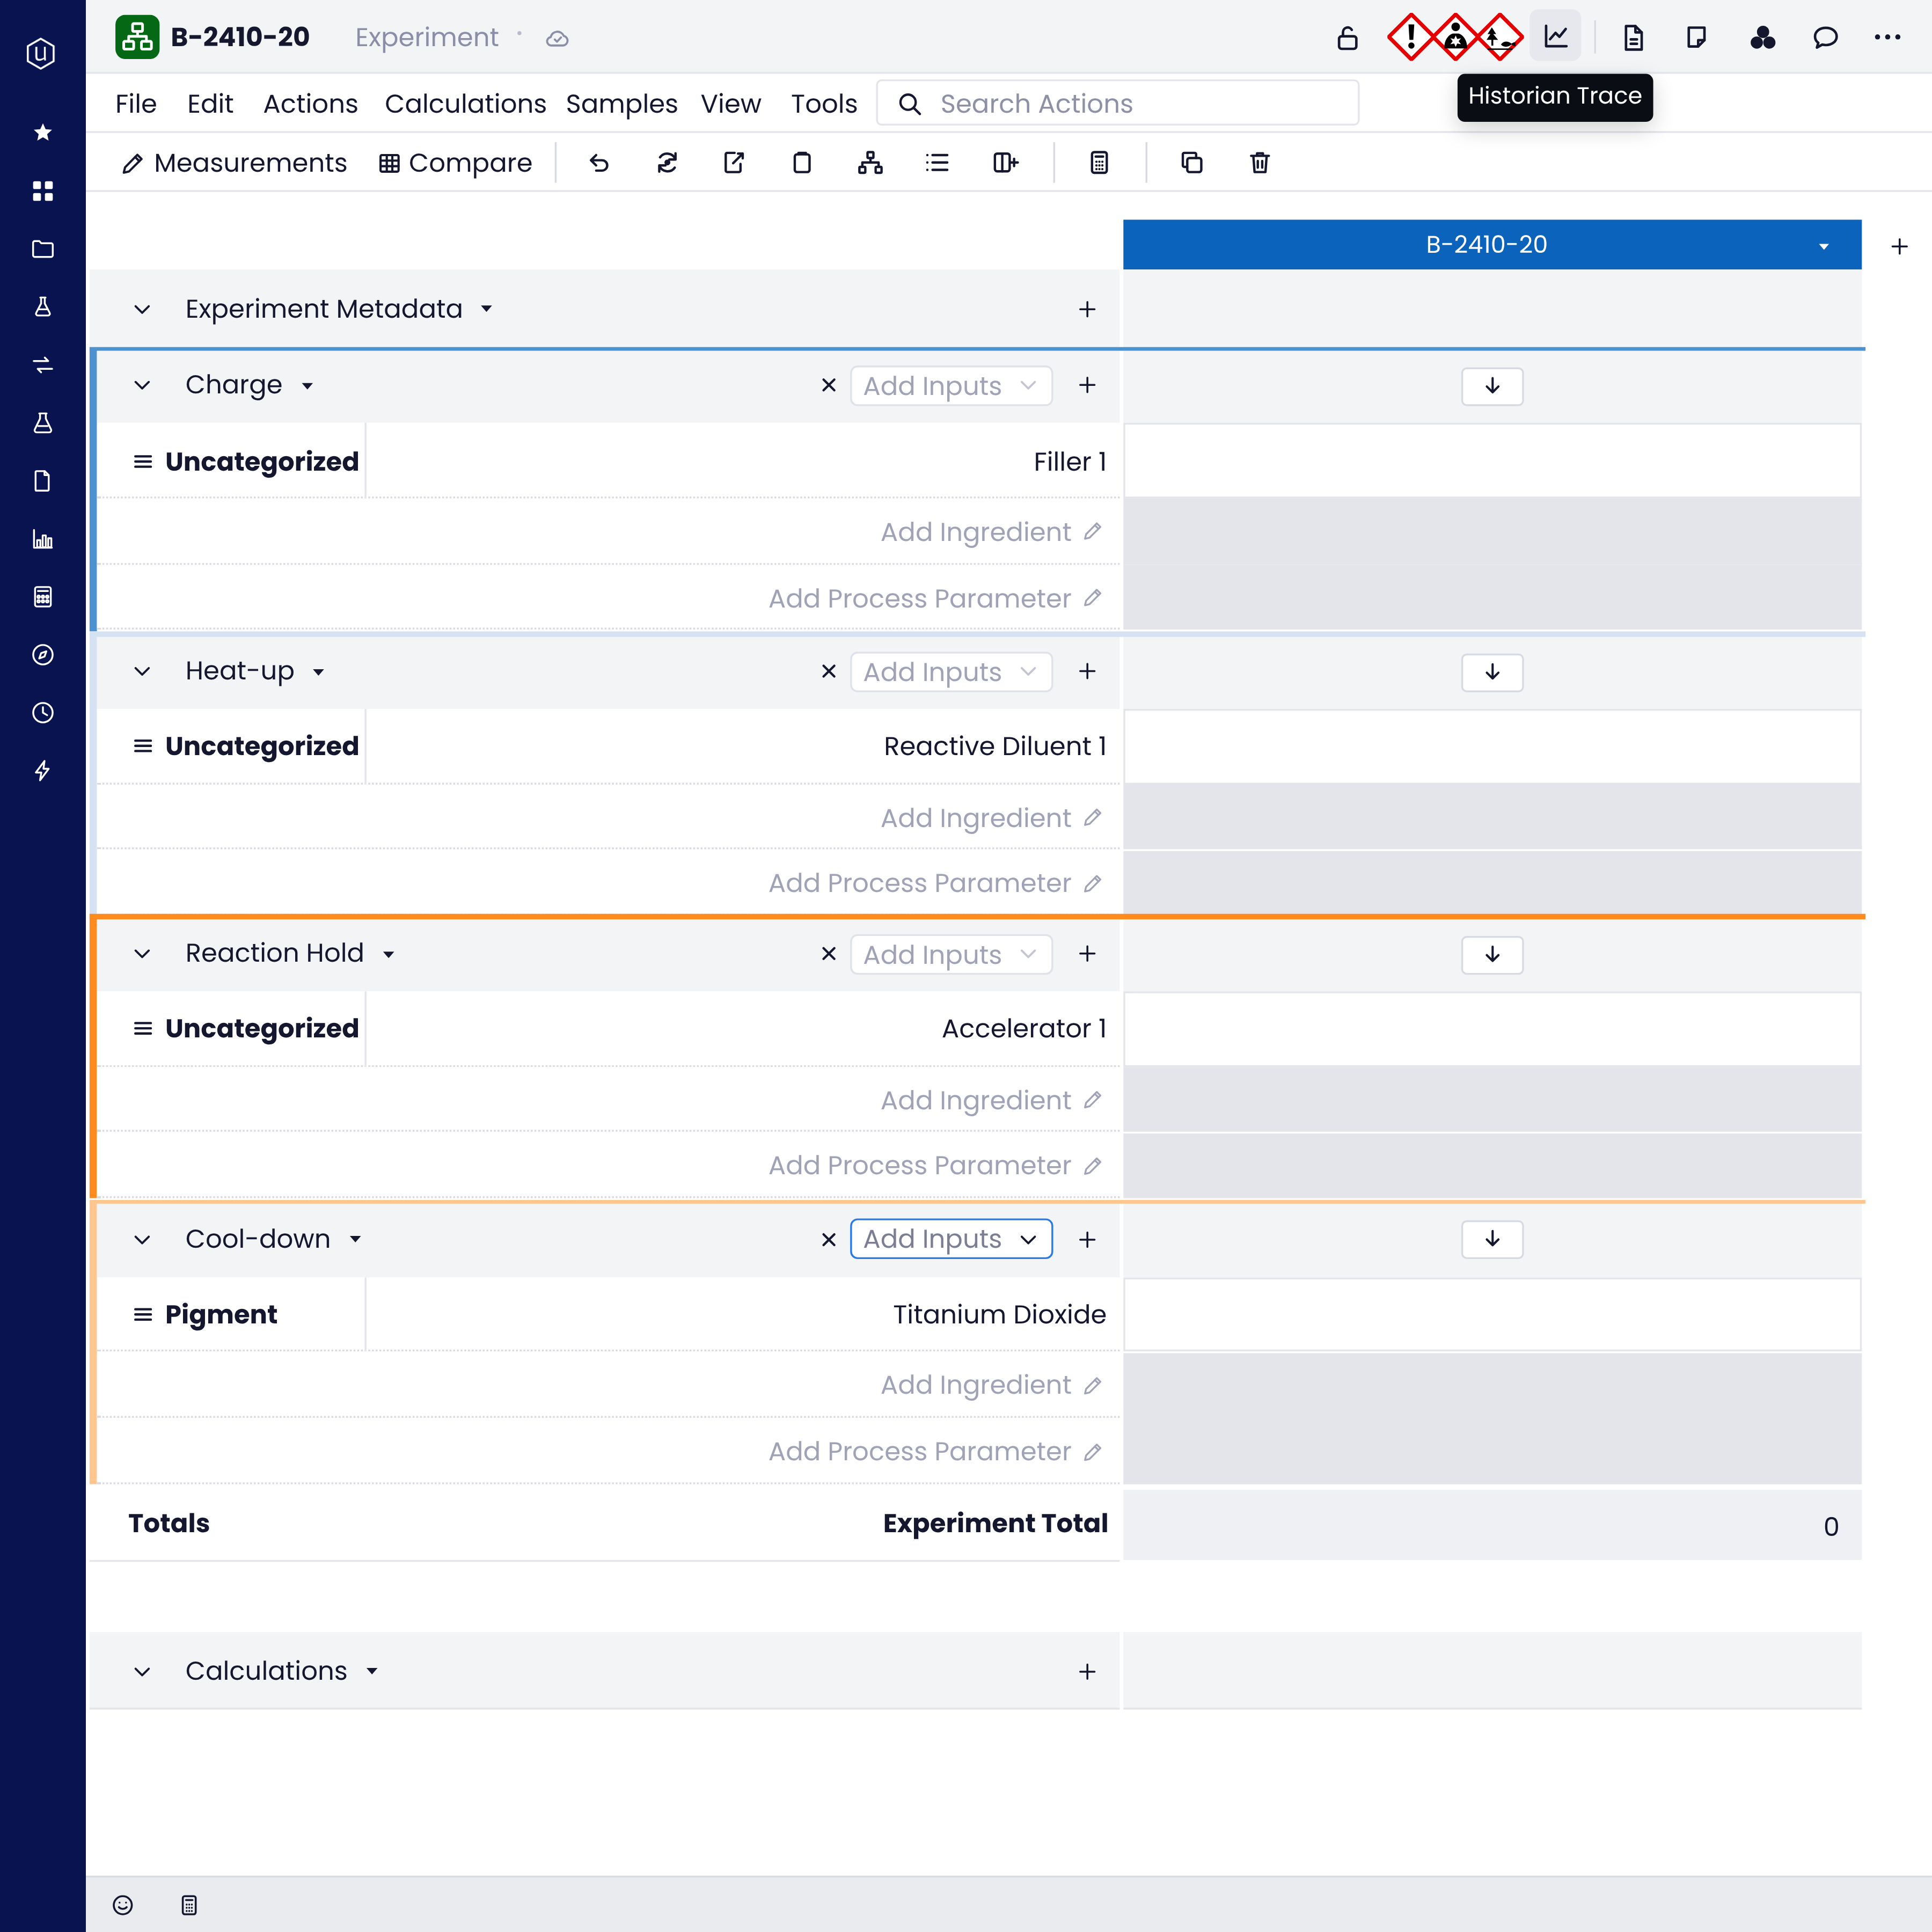
The recipe and settings for the batch, next to how the run actually went.
Test results
QC and R&D results on the same record as the conditions that produced them.
Lab requests and equipment
Tags bound to the equipment they sit on and the requests they served.
IBodie
Ask Uncountable's AI assistant to read tag data and summarize what happened during a run.
So the process conditions sit next to the formulation and the result, with no second system to cross-check.
Support from setup through everyday use:
Dedicated expertise
A team that knows manufacturing and QC workflows helps choose the tags that matter and bind them to your batches.
Integration help
Our implementation team scopes and sets up the integration from your existing plant historian or equipment, so your engineers don't have to build it.
Start small
Begin with the equipment that matters most and add tags as the value shows up.
One platform
Process data sits with your R&D and QC records instead of in another standalone system.
Start with one reactor, prove the value on real batches, then add equipment from there.
See a failed batch traced to its step
A temperature and pressure spike on a reactor comes before a QC fail. Watch Uncountable Data Historian find the batch it hit and place the spike inside the step it happened in.
Where the historian earns its place
The trace shows the conditions during each step, so the team can see whether the run itself caused the result.
Compare the same step on the small and large runs to see which conditions shifted.
Points lines up every tag on the equipment at that moment, ready for the investigation.
Run rules highlight readings that break the pattern on the tag's trend chart, before the drift reaches a batch result.
Correct the step times on the trace so every window matches what actually happened.
Process data already linked to experiments and results is ready to analyze alongside formulation data.

Put process conditions on the same record as every result.
When tag data is bound to the batch, the step and the result, a failed batch comes with its evidence attached. R&D, QC and process engineering work from the same view.
FAQs
A data historian collects and stores time-stamped measurements from equipment, sensors and control systems, so teams can review how a process behaved over time.
No. Keep your plant historian. Uncountable Data Historian adds the batch context it lacks, binding tag data to the experiments, steps and QC results in Uncountable. For lab and pilot equipment that has no historian today, it can also run on its own.
No. It works on its own for plant, pilot or lab equipment. Teams that already use Uncountable get the batch, step and result links straight away.
Our implementation team sets up the integration with you. We have connected established plant historians, industrial connectivity servers and cloud time-series databases before. Tag data reaches Uncountable through its API or SDK, in batches or as a continuous stream.
An open chart refreshes about every 15 seconds, which suits batch review, investigations and equipment monitoring.
Bring us the batch nobody could explain