Stop charting last month's process
Catch drift while you can still act on it, not after a customer flags it. SPC runs on the QC results you already record, linked to the batch, the raw material lots and the results that go on your CoA. No exports to a separate stats tool.
Deployed by 175+ enterprise product development teams







Deployed by Enterprise R&D and Innovation Teams



By the time the chart shows it, you've already made it
In most QC labs, the results and the statistics live in different places. Data gets pulled from the ERP or a spreadsheet into a stats package or a BI dashboard, often only after something looks wrong, and charted weekly or monthly. By then the process has already run and the batch has shipped. A parameter can trend toward the upper control limit for months while every result stays in spec and every CoA passes. And when a point does go out of line, the batch record and the raw material lots that would explain it are somewhere else.
- ✕
Pulling data out of the ERP into a stats package after something goes wrong
- ✕
CoAs that pass while the process slowly drifts
- ✕
A red cell in a spreadsheet, and no link back to the batch
- ✕
Paper batch records at one plant, a batch logger at another
- ✓
Charts run on QC results as they're entered, with nothing to export
- ✓
Drift toward a control limit shows up before a result fails spec
- ✓
Western Electric-style run rules flag the points that break pattern, in red
- ✓
Every point links back to its batch, formulation and raw material lots
From measurement to investigation
The chart runs on the QC results your lab already records. Nothing to export, nothing to reconcile.
Charted from recorded output: SPC charts update from QC results recorded in the platform, entered by your lab or brought in from connected instruments.
Control limits and run rules: Western Electric-style run rules, set per parameter, flag a point beyond a sigma limit or a run on one side of the mean. Points that break a rule show in red.
Limits from a stable process: Set the baseline from a known-good run, so one bad fortnight doesn't quietly redefine normal.
Capability next to the chart: Cp and Cpk per parameter in a statistics table, so you can see a falling Cpk before it shows up as a failed batch.
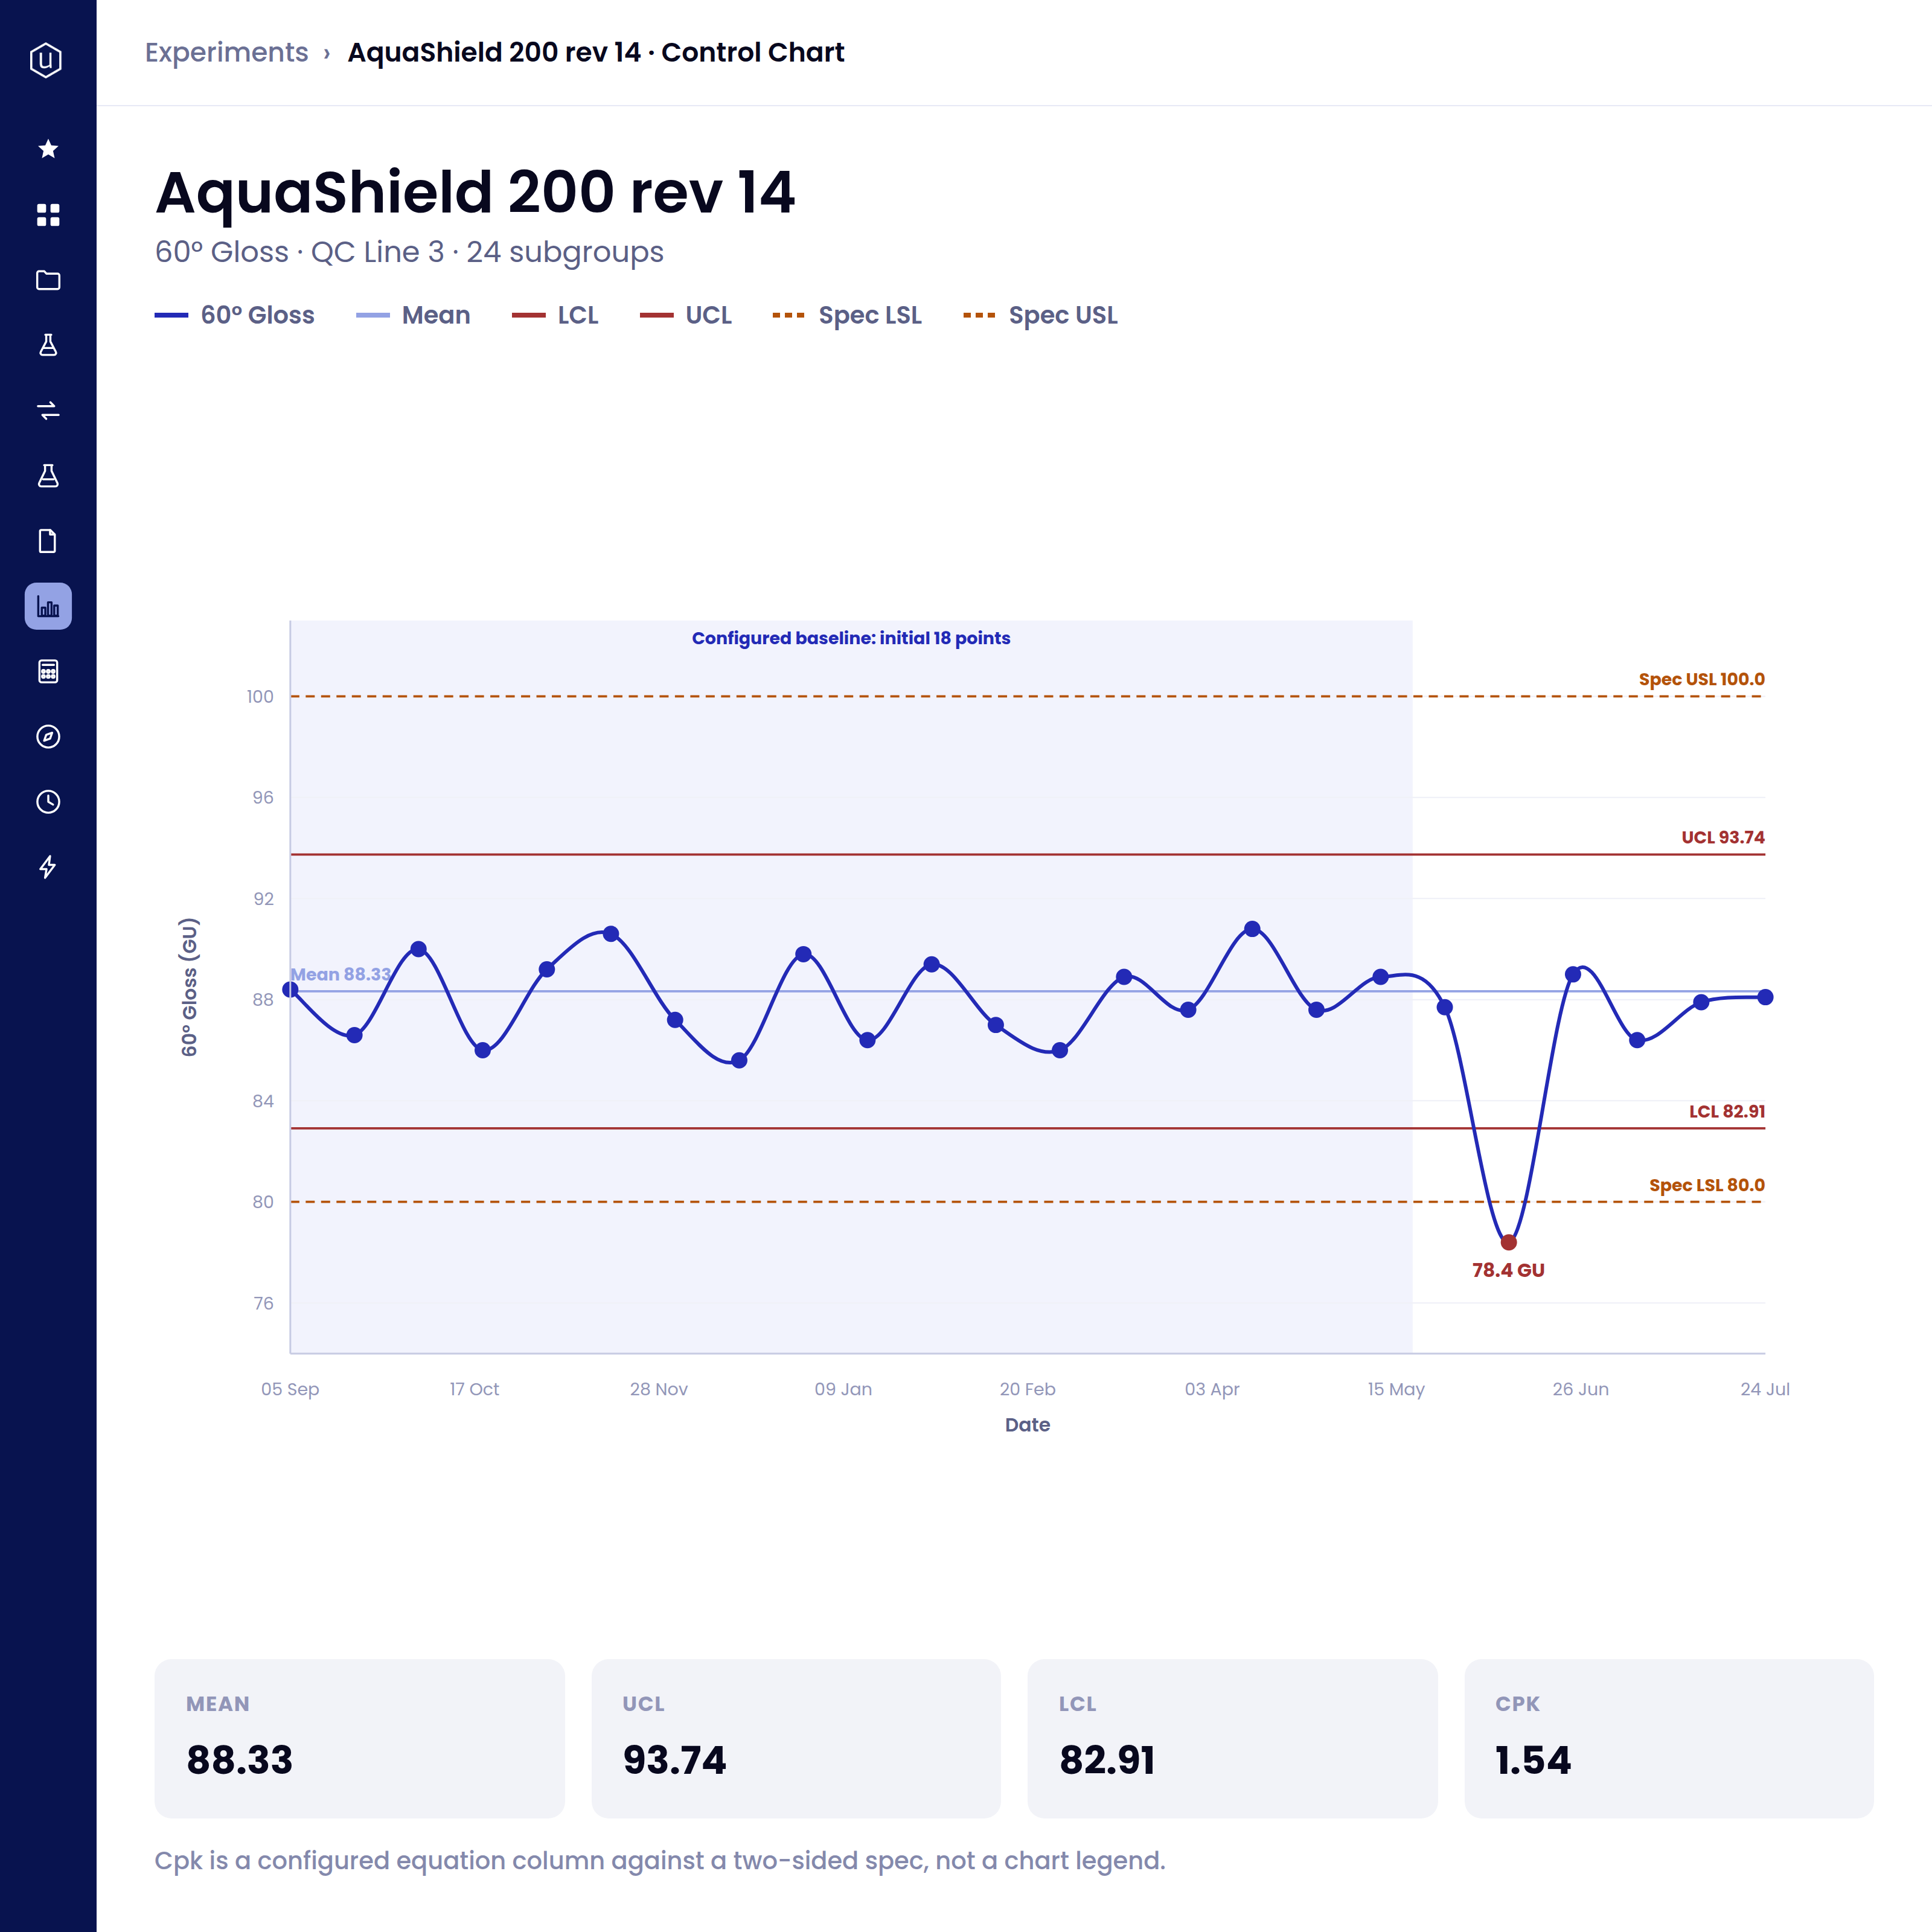
A flagged point is only useful if you can get from it to the batch and the raw material lots behind it.
Spec check on entry: Each result shows against its spec as it's entered, pass or fail, with a link to the batch record.
Order it the way you think about it: Sequence the chart by batch, by date or by raw material lot.
Get to the batch and the material: Go from a charted point to its batch record, formulation and raw material lots.
Compare capability across outputs: Mean, standard deviation, RSD% and Cpk per parameter show which one is least capable before you decide where to look.
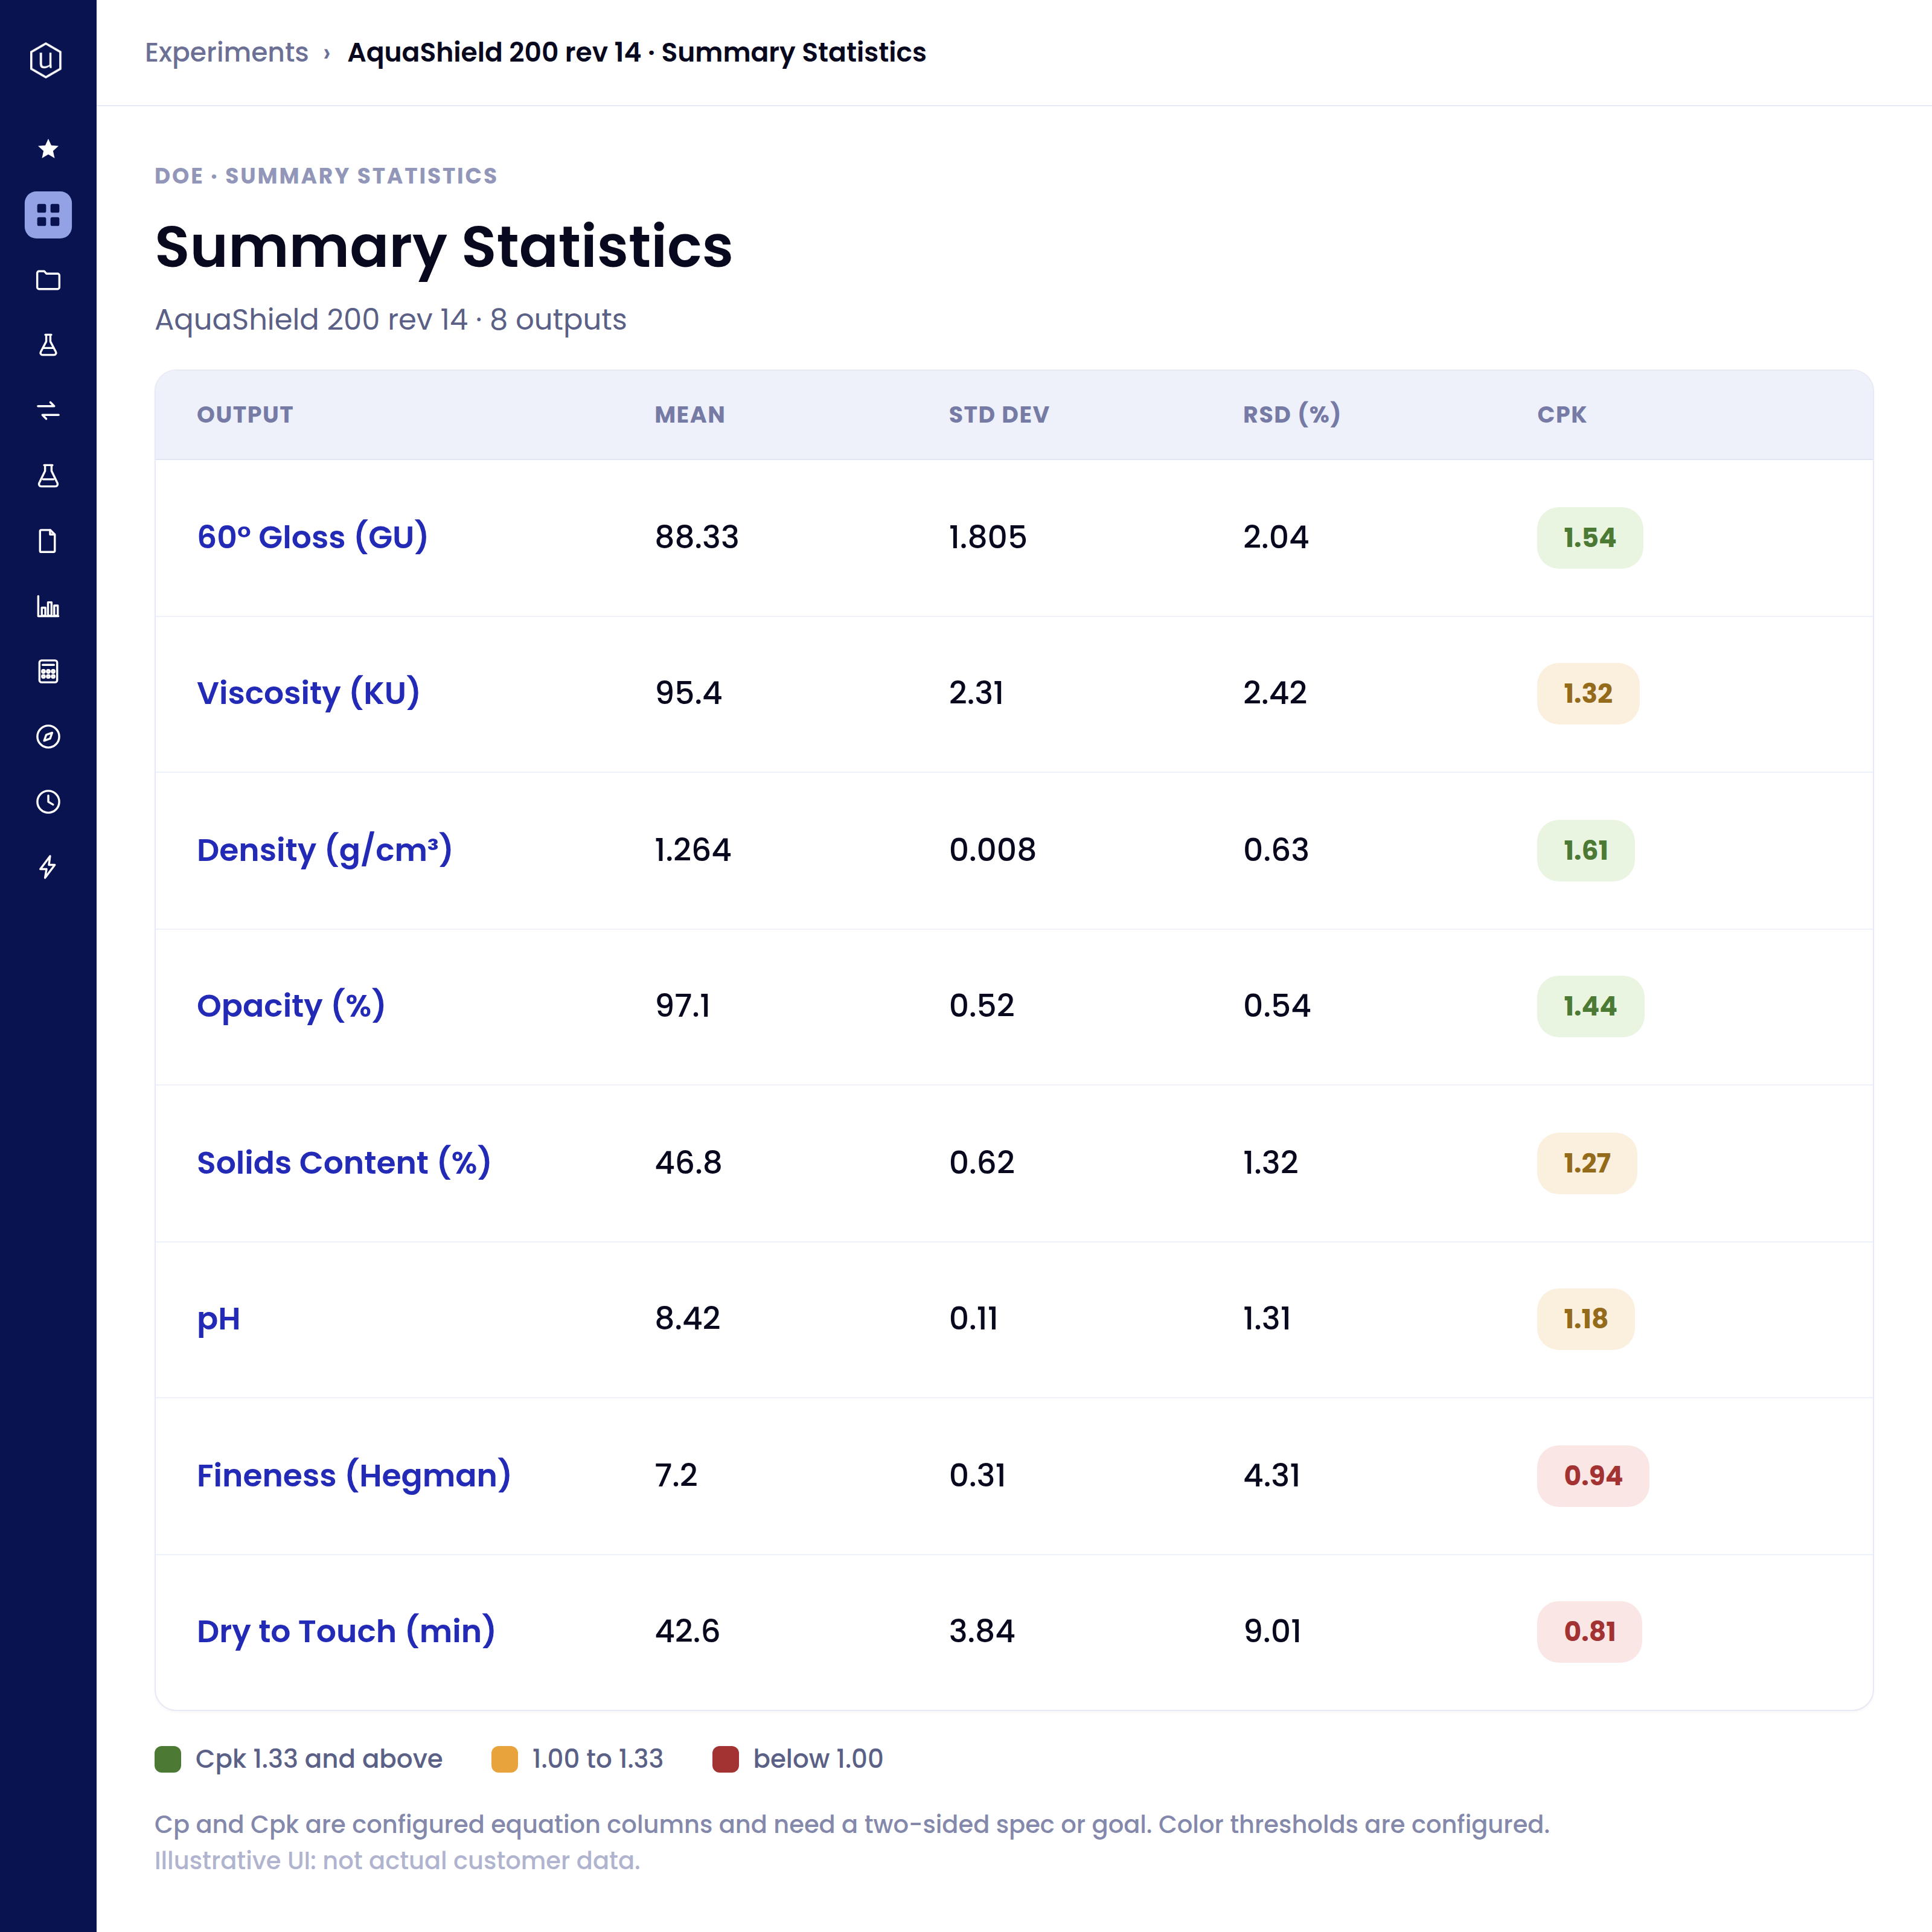
When a result goes out of spec, the investigation starts from the record, with the evidence already attached.
Out of spec, into investigation: An out-of-spec result shows red on entry and starts an investigation.
Your quality process, not ours: Quarantine decisions, CAPAs, reviews, approvals and e-signatures follow the workflow your quality team defines.
The evidence stays attached: The chart, the batch, the investigation and the approval sit on the same record, so the trail from signal to closure is there when a customer or auditor asks for it.
Re-baseline after a change: When a spec or formulation change is released, reset the baseline so the new process isn't judged against the old one's limits.
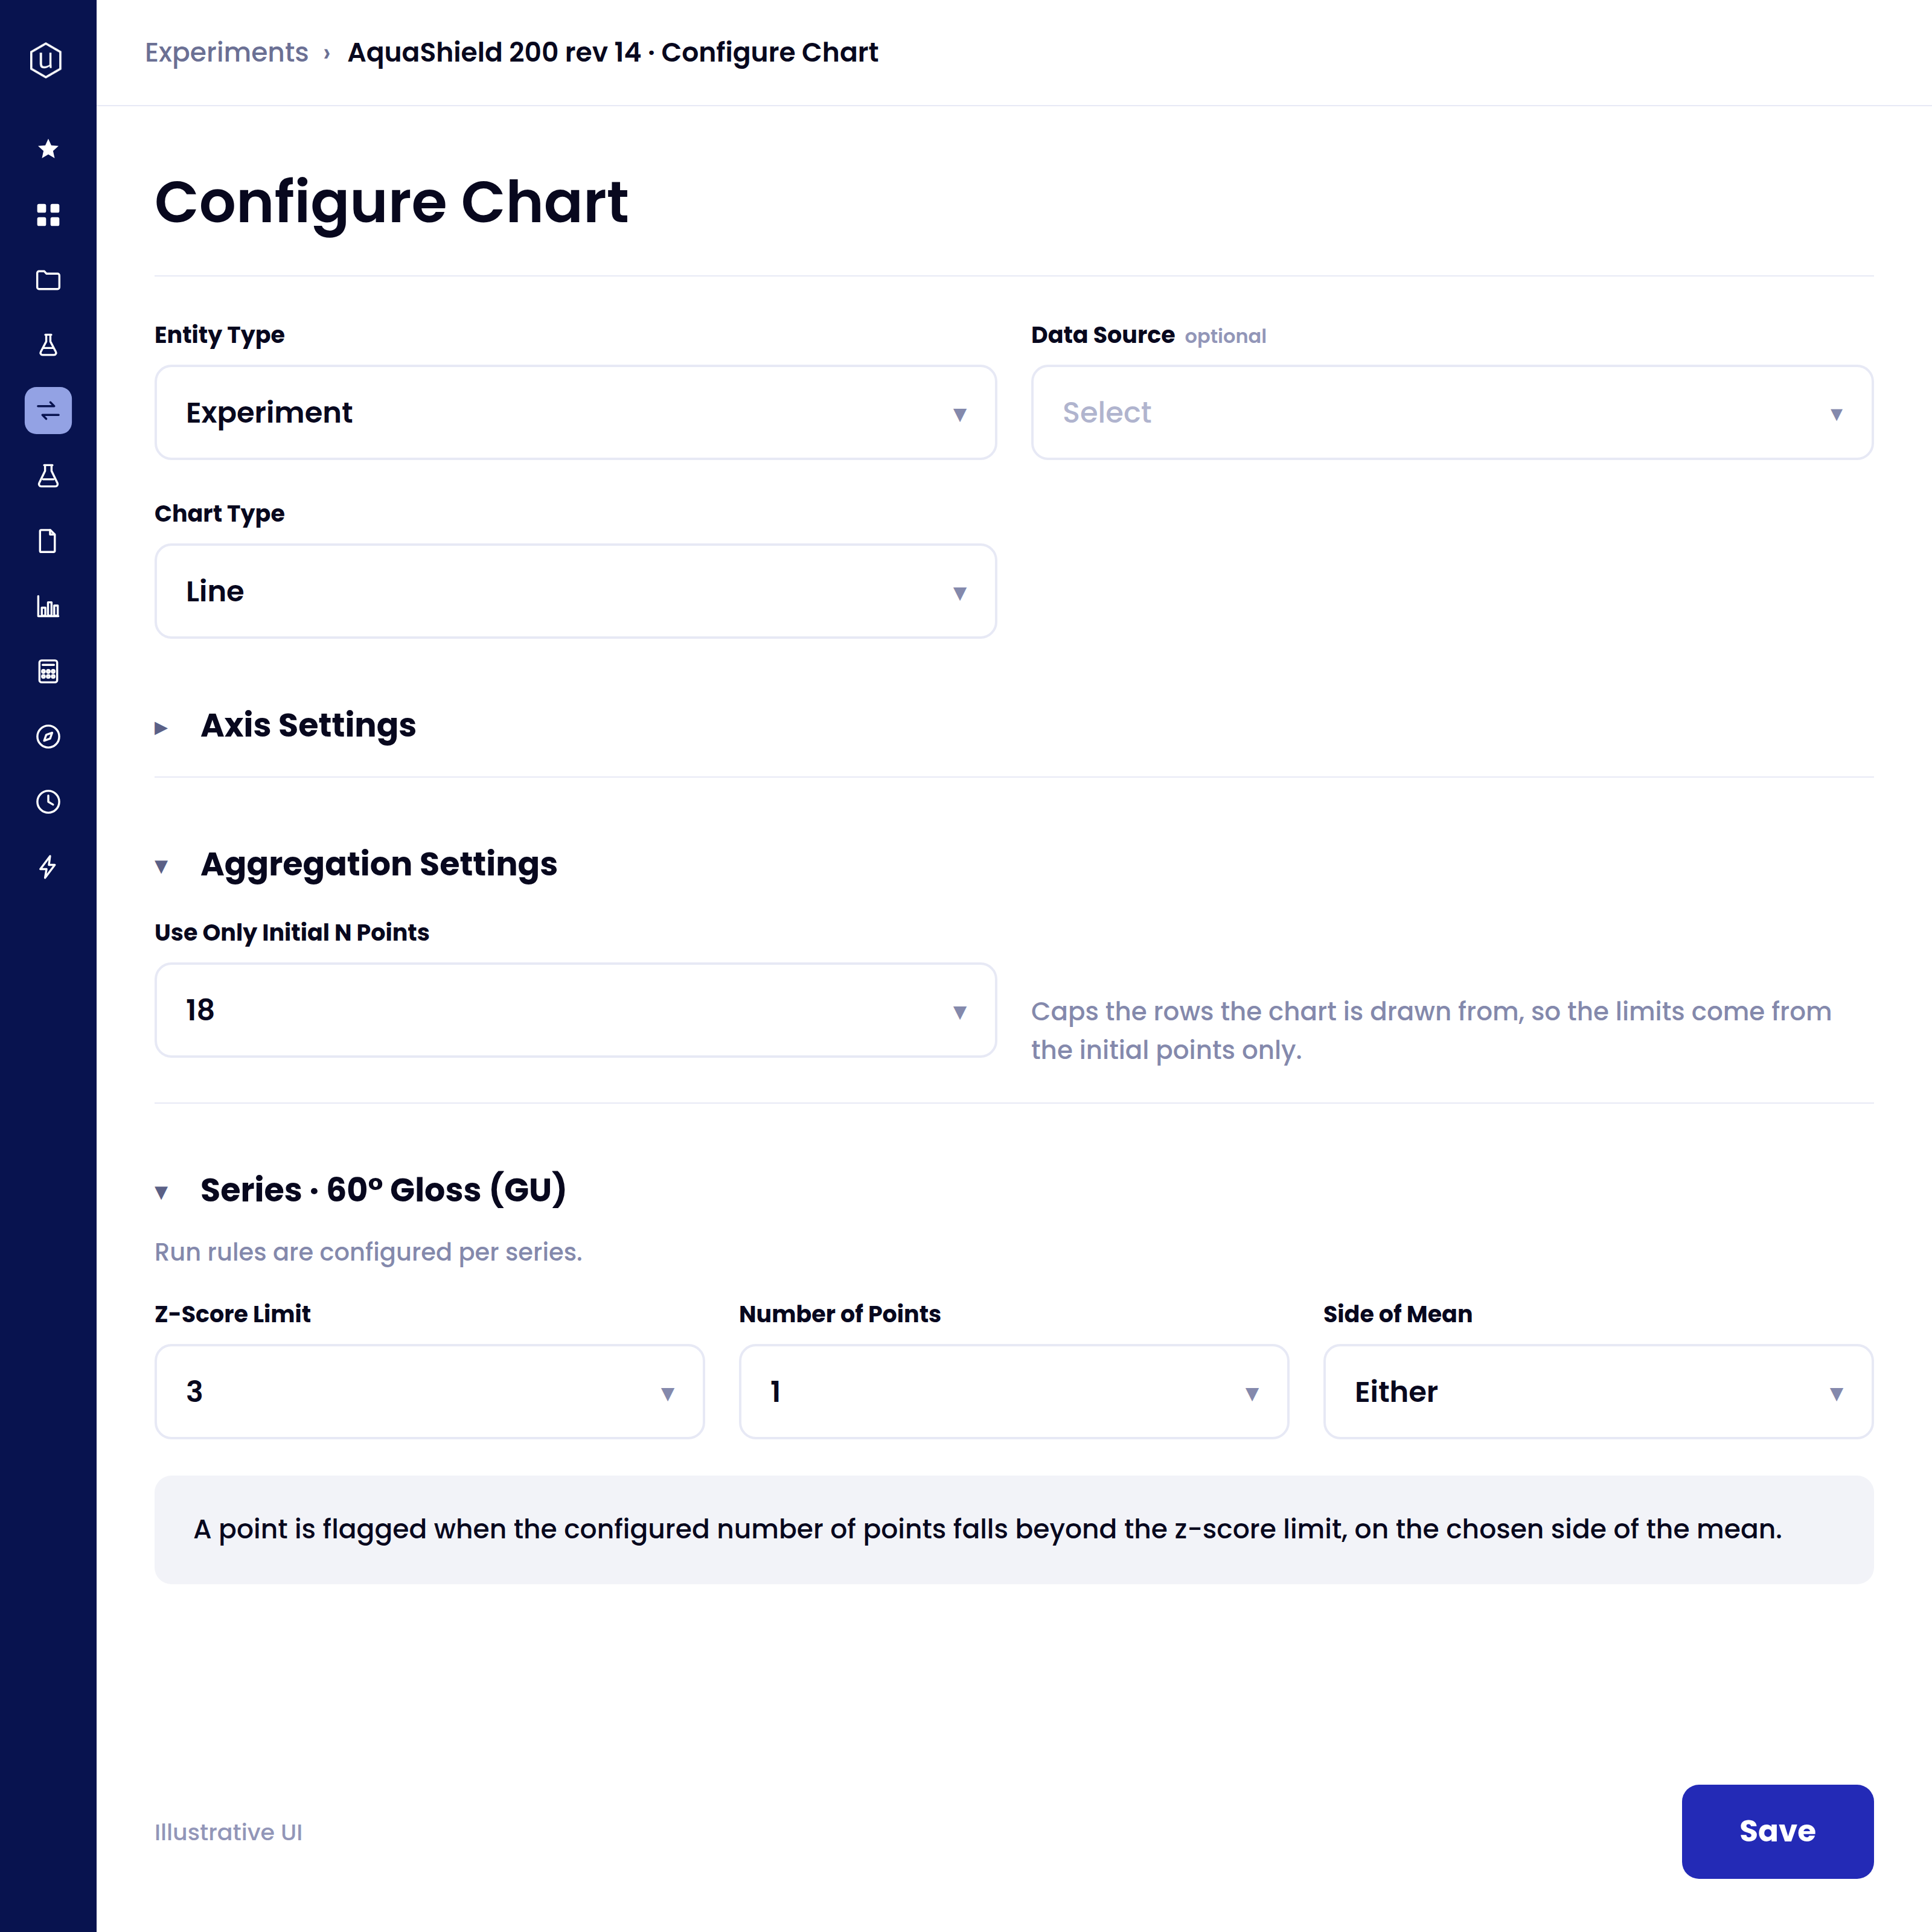
Built for processes where the product is a batch
Formulation-native and flexible
Built for formulas, grades and campaigns, where variants are the norm rather than the exception.
Bidirectional integrations
Two-way sync with SAP and other ERPs, plus lab instrument connections that bring readings straight onto the record.
One standard across plants
Whether a plant runs on paper, spreadsheets or a batch logger today, every site charts the same parameter the same way, so you compare like with like.
Accelerated by Bodie
Uncountable's Gen AI assistant, guided by plain-language prompts, working against the same record your charts run on.


Most systems tell you something changed. We show you what.
FAQs
Statistical process control charts a measured parameter against limits derived from the process's own behavior, rather than only against the release specification. A result can sit inside spec and still signal that something has changed, which is what makes a control chart different from a pass or fail check.
The charts are built from QC results already recorded in Uncountable, so there is no export step and no second copy of the data to keep in sync. The batch record, formulation and raw material lots sit in the same platform, and the links from a charted point to those records are set up to match how your data is structured.
A line chart of recorded QC results with the mean, upper and lower control limits, and spec lines. Limits are calculated from the results in scope, and setting the baseline from a known-good period keeps a known excursion out of that calculation. Run rules are set per parameter, and points that break a rule show in red. The chart is in batch order by default; add a date or lot field to sequence it by time or by raw material lot. Cp and Cpk come from a statistics table rather than the chart itself, and both need a two-sided spec or goal and the right data scope.
An out-of-spec result shows red as it's entered and starts an investigation. Quarantine, CAPA, reviews, approvals and e-signatures follow workflows set up to your quality process. They don't fire automatically from a result.
Run rules are set per parameter using a sigma limit, a number of consecutive points and a side of the mean. That covers the common Western Electric-style checks, such as a point beyond 3 sigma or a run of points on one side of the mean. If your team relies on specific Nelson rules, bring them to the demo and we'll walk through how they map.
Chart your own process.