R&D key performance indicators (KPIs) are the measures leaders use to judge whether research and development is resolving technical uncertainty, improving products, and creating value the business needs. The most useful R&D KPIs cover development speed, technical progress, cost, product improvement, quality, resources, and portfolio fit, and each one is tied to a decision someone has to make.
Research and development performance is not captured by the number of experiments completed, projects opened, or dollars spent. Those figures describe activity and investment. They do not necessarily show whether teams are resolving technical uncertainty, improving products, or delivering outcomes the business values.
Useful R&D key performance indicators connect research activity to decisions. They help leaders identify development bottlenecks, allocate technical resources, assess portfolio progress, and understand whether investment is producing commercial, operational, or quality improvements.
The challenge is choosing measures that reflect the work without oversimplifying it. An exploratory research program, a customer-requested reformulation, and a supplier-substitution project have different objectives. They should not all be judged against the same definition of success.
Start R&D KPI selection with the decision
Before choosing an R&D KPI, identify the question it needs to answer.
If development projects repeatedly miss launch dates, measure where time accumulates, not just the total development period. If analytical testing constrains several programs, examine queue time and available capacity. If the business needs to reduce supply risk, track whether replacement materials have been qualified and affected products are ready for the change.
This keeps the measurement program focused on action. A metric should have a clear purpose, an owner who can interpret it, and an agreed response when performance changes.
It also helps distinguish what R&D controls from what it influences. Researchers can improve technical readiness, but product revenue also depends on pricing, sales execution, market demand, and launch timing. Commercial outcomes matter, but they need to be interpreted alongside those dependencies.
Balance input, output, and outcome metrics
Input metrics describe the resources committed to R&D. Examples include project expenditure, scientist or engineer hours, instrument capacity, and pilot-plant availability.
Output metrics describe what the work produces, such as completed technical evaluations, validated formulations, qualified materials, or released products. Outcome metrics go further by examining the value created: improved product performance, lower manufacturing costs, reduced supply risk, or revenue from new products.
Use these measures together. Lower development spending is not necessarily an improvement if it delays essential work. More completed experiments are not necessarily productive if they repeat previous work or fail to resolve a technical question.
Exploratory projects also need appropriate measures. A well-supported decision to stop an infeasible concept can be a valuable result, even though it does not lead to a launch. The measurement system should recognize useful learning rather than encourage teams to keep weak projects moving.
R&D KPIs to consider
The following measures provide a starting point, not a universal scorecard. The definitions are suggested approaches; adapt them to your project stages, reporting periods, and business objectives. Part 2 of this series looks at the top metrics in more detail.
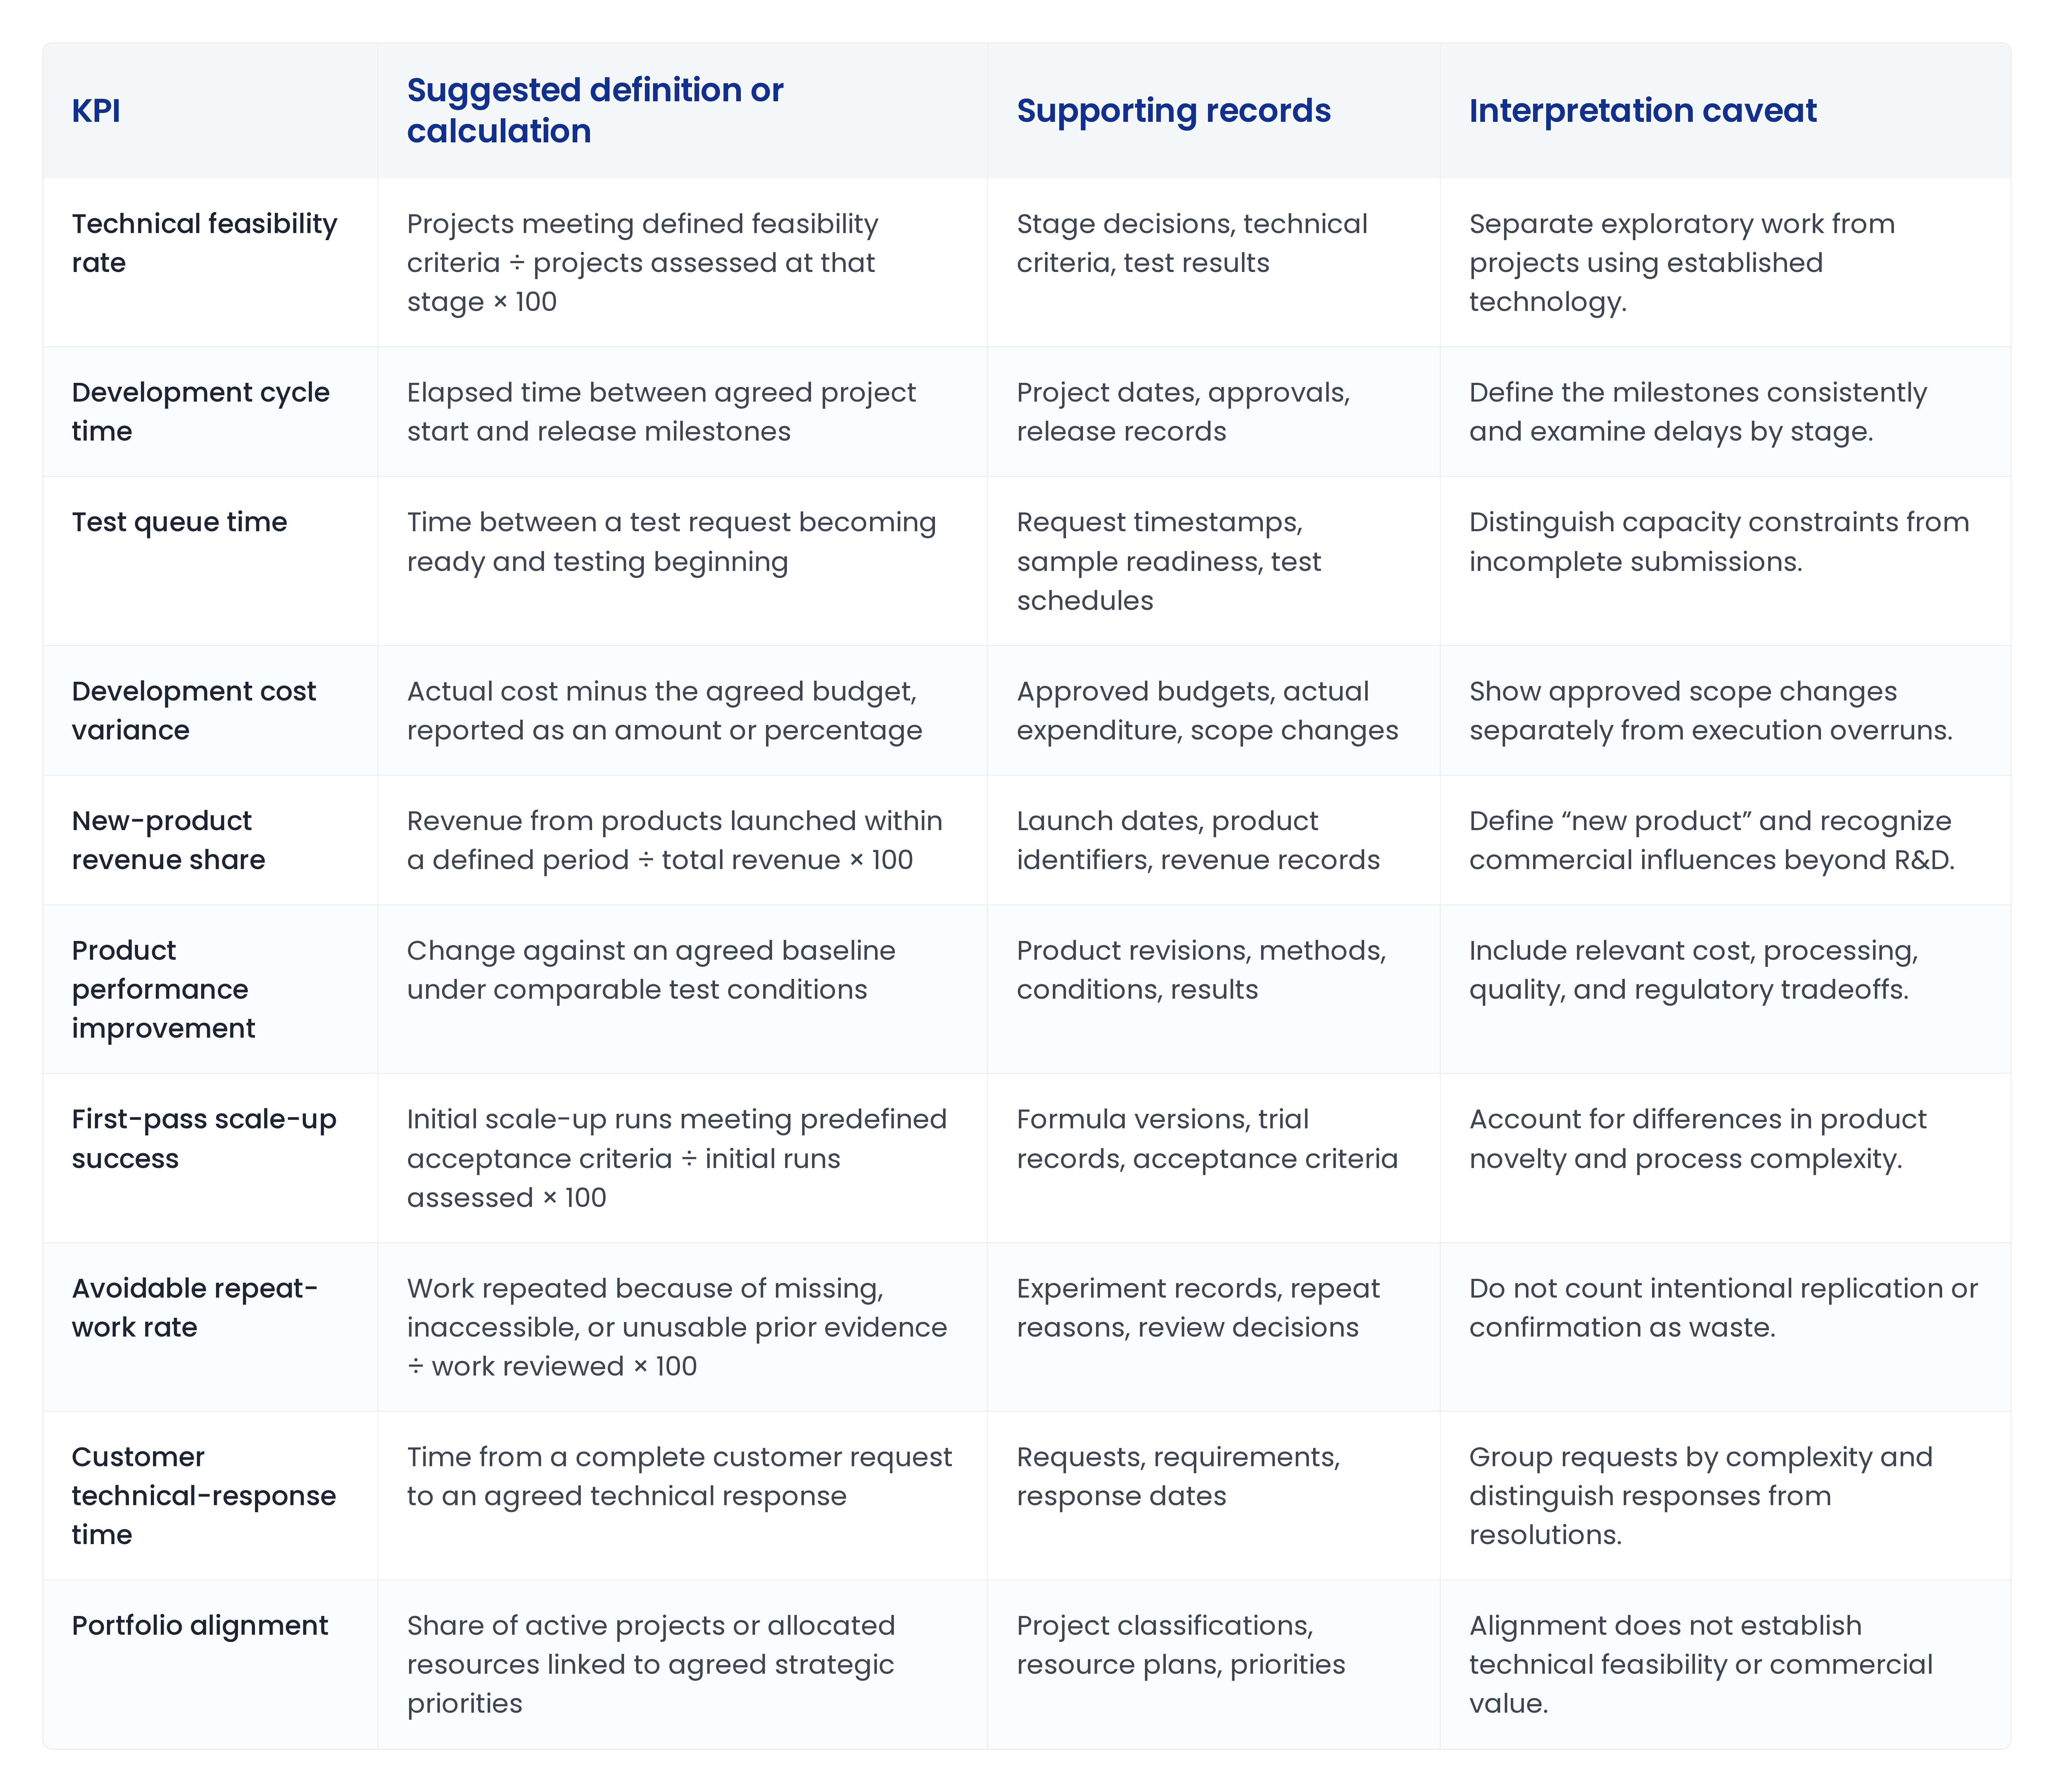
Innovation and technical progress metrics
Innovation metrics should show whether R&D is creating useful options and advancing the strongest ones.
Measures may include concepts reaching feasibility, projects achieving defined technical milestones, successful launches, adoption of new platform technologies, and reuse of prior research. The relevant mix depends on the business.
A specialty-chemicals company might emphasize revenue from recently introduced products. A materials team might prioritize validated improvements in strength, conductivity, or thermal performance. An early-stage research group may focus on resolving critical uncertainties before committing further investment.
Avoid treating idea submissions, patent counts, or experiment totals as sufficient evidence of innovation. They can provide context, but their value depends on what they contribute to the development strategy.
Development speed and bottleneck metrics
Total time to market shows how long development took. Stage-level measures explain why.
Track the periods that matter to your workflow: laboratory development, analytical testing, stability studies, supplier qualification, pilot trials, customer validation, quality review, and manufacturing release.
For example, a formulation project may complete laboratory screening quickly but then wait six weeks for pilot-plant capacity and another month for supplier qualification. A single cycle-time figure hides these constraints. Stage-level measures show whether the response should involve more capacity, earlier qualification work, or different scheduling.
Pair speed measures with quality and readiness measures. A shorter development cycle is not an improvement if it creates avoidable scale-up failures or repeated reformulation.
Financial value and investment metrics
Financial metrics should distinguish investment, expected value, and realized results.
Project spending shows what has been committed. Cost to complete estimates the resources still required. Expected revenue or margin describes potential commercial value. Realized savings or margin improvements show what happened after implementation.
Risk-reduction projects need a different lens. A raw-material substitution may generate little new revenue but protect an existing product after a supplier discontinuation. Assessing it only against new-product sales would overlook its purpose.
Keep financial assumptions visible. Forecasts should state their time horizon, commercial assumptions, and treatment of uncertainty. Avoid presenting estimated benefits as realized returns.
Product improvement metrics
Product improvement measures should reflect the properties customers and the business need.
For coatings, these might include adhesion, durability, gloss retention, application behavior, VOC (volatile organic compound) reduction, or cost. For personal care, they might include stability, sensory performance, preservative efficacy, and packaging compatibility.
Every improvement needs a defined baseline and comparable evidence. Identify the product or formula version, test method, operating conditions, and acceptance criteria.
A durability improvement, for example, should be assessed alongside its consequences. Did it increase raw-material cost? Change processing requirements? Affect another performance property? A single favorable result should not obscure a less favorable overall product decision.
Quality and readiness metrics
Quality metrics help teams assess whether development work is ready for production, release, and customer use.
Useful measures include first-pass verification, scale-up success, change-related deviations, investigation closure time, qualification status, and complaints associated with newly launched products.
Use these signals to investigate the development process rather than simply rank teams. Repeated late-stage specification changes may indicate unclear requirements. Scale-up deviations may reveal that laboratory conditions did not represent manufacturing. Customer complaints may expose gaps in application testing.
Connect each event to the relevant product version, materials, process conditions, test evidence, and approval decisions. Those relationships make the metric useful for investigation.
R&D resources and productivity metrics
Productivity measures should help identify where technical capacity is being lost or constrained.
Relevant measures include critical-test queue time, workload by role, pilot-plant availability, avoidable repeat work, and time spent finding or preparing data. Experiment counts can supplement these measures, but they should not become individual production targets.
High instrument utilization is not automatically healthy. It may indicate productive use of capacity, or it may leave no flexibility for urgent work and create long queues.
Similarly, repeated experiments require interpretation. Deliberate replication supports confidence in a result. Repeating work because the original conditions or findings cannot be retrieved points to a different problem: lost learning.
Customer and portfolio performance metrics
Customer metrics connect technical work with the needs it serves. Examples include response time, acceptance of proposed formulations, completion of requested reformulations, and successful technical-service resolutions.
Portfolio metrics show whether resources are distributed appropriately across growth, customer commitments, maintenance, compliance, and exploratory work.
An organization may have a promising research pipeline but insufficient capacity for urgent customer requests or required material substitutions. A portfolio view makes the conflict visible so leadership can decide what to prioritize, defer, or resource differently.
Define each R&D KPI consistently
A KPI needs a written definition before it belongs on a dashboard.
Specify its purpose, calculation, unit, reporting period, source records, owner, and exclusions. For cycle time, define when the clock starts and stops, whether paused projects remain included, and how canceled projects are reported. For new-product revenue, define the launch window and what qualifies as a new product.
Document changes to the definition. Otherwise, an apparent performance improvement may result from a different calculation rather than a better process.
Compare like with like. Separate exploratory research from routine reformulation, and consider project complexity, technical novelty, site, or product family where those differences affect interpretation. Report the underlying project count alongside percentages so readers can judge the size of the evidence base.
Connect R&D metrics to the evidence behind them
The records behind a KPI should make it possible to explain the result.
A project-delay metric needs stage dates and reasons for waiting. A performance-improvement metric needs the baseline, method, conditions, and product revision. A scale-up measure needs trial records and acceptance criteria. A commercial measure needs consistent links between development projects and released products.
When these records sit in disconnected spreadsheets, instrument files, and project trackers, teams may spend more time reconciling the report than interpreting it. Inconsistent identifiers and missing context also make comparisons difficult.
Structured, connected data helps preserve the relationship between experiments, formulations, test results, quality events, project milestones, and product outcomes. The dashboard remains a starting point; the linked evidence explains what deserves attention.
Build a focused R&D KPI program
Start with the current business priorities and constraints rather than adopting every available metric.
- Select the decisions the measurement program needs to support.
- Choose a focused set of measures covering progress, resources, and outcomes.
- Define each calculation and confirm that the supporting records are available.
- Establish a baseline before setting improvement targets.
- Assign review owners and agree how findings will inform action.
- Review the measures periodically and retire those that no longer support decisions.
Match the review frequency to the work. Test queues may need frequent attention, while commercial outcomes may require a longer observation period.
The purpose is not to make research appear predictable. It is to give teams a clearer view of progress, uncertainty, and constraints while there is still time to act.
Explore Uncountable’s platform to learn more about connecting R&D, quality, and product data.